

When trading forex, one of the most critical skills to master is how to read and analyze forex charts. These charts provide a visual representation of price movements over time, helping traders make informed decisions. In this blog, we’ll break down how to read forex charts and use technical analysis to spot opportunities in the market.
If you’re looking to sharpen your skills and take your trading to the next level, join EPIQ Trading Floor for a 3-day free trial and access exclusive trading tools, signals, and more!
What is a Forex Chart?
A forex chart is a graphical representation of the price of a currency pair over time. It helps traders visualize past price movements and predict future trends. Charts can be displayed in different time frames (e.g., 1 hour, 4 hours, daily), depending on your trading strategy and style. The three most commonly used types of charts in forex trading are:
- Line Chart: Simplest form, showing a line connecting closing prices over a time frame.
- Bar Chart: More detailed, showing opening, high, low, and closing prices (OHLC) for each period.
- Candlestick Chart: The most popular type of chart, providing the same information as a bar chart but in a more visually intuitive format.
Understanding the Key Components of Forex Charts
Currency Pairs
Forex charts display the price movements of currency pairs. Each pair consists of a base currency and a quote currency, such as EUR/USD (Euro/US Dollar). The price on the chart indicates how much of the quote currency is required to buy one unit of the base currency.
Time Frames
Forex charts can show price movements in various time frames, ranging from 1-minute to monthly views. The choice of time frame depends on the type of trader you are:
- Scalpers may use shorter time frames (1-minute or 5-minute charts).
- Day traders typically rely on 15-minute or hourly charts.
- Swing traders may look at 4-hour or daily charts.
Understanding how to switch between time frames is crucial for identifying trends and patterns in different trading windows.
Price Movements
Price movements are the essence of any chart. The vertical axis represents the price of the currency pair, while the horizontal axis represents time. A rising price on the chart indicates the base currency is strengthening relative to the quote currency, while a falling price shows the opposite.
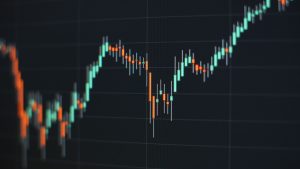
How to Read Candlestick Charts
Candlestick charts are the most commonly used type of chart in forex trading. Each candlestick represents a specific time frame, with four key components:
- Open: The price at the start of the time frame.
- Close: The price at the end of the time frame.
- High: The highest price reached during the time frame.
- Low: The lowest price reached during the time frame.
Candlestick Patterns
Candlesticks can form specific patterns that traders use to predict market trends. Some common candlestick patterns include:
- Doji: Signals market indecision and potential reversals.
- Hammer: A bullish reversal signal indicating that buyers are stepping in.
- Engulfing: A reversal pattern where a larger candlestick engulfs the previous one, signaling momentum shift.
Recognizing these patterns is an important part of using technical analysis to inform your trading decisions.
Using Technical Indicators to Analyze Forex Charts
Moving Averages
Moving averages smooth out price data to help you spot trends. A simple moving average (SMA) calculates the average price over a set number of periods, while the exponential moving average (EMA) gives more weight to recent price movements. Traders often look for crossovers between short-term and long-term moving averages to signal potential buy or sell opportunities.
Relative Strength Index (RSI)
The RSI is a momentum indicator that measures whether a currency pair is overbought or oversold. A reading above 70 suggests that the asset is overbought and might be due for a correction, while a reading below 30 indicates oversold conditions and a potential buying opportunity.
Fibonacci Retracement
Fibonacci retracement levels are horizontal lines that indicate potential support or resistance areas. These levels are drawn based on the Fibonacci sequence and can help you identify where the price might retrace before continuing in its original direction.
Spotting Trends and Patterns
Uptrends and Downtrends
Identifying the overall trend is essential in forex trading. An uptrend is characterized by higher highs and higher lows, while a downtrend consists of lower highs and lower lows. When reading forex charts, always start by determining the primary trend direction before making any trading decisions.
Support and Resistance
Support and resistance levels are horizontal lines that represent price points where the market has a tendency to reverse. Support is a price level where demand is strong enough to prevent the price from falling further, while resistance is a level where selling pressure is strong enough to prevent the price from rising.
These levels act as potential entry or exit points for traders and are a fundamental part of technical analysis.
How to Apply Technical Analysis in Forex Trading
Combine Multiple Indicators
The most successful traders don’t rely on just one indicator. Instead, they combine several tools to get a clearer picture of the market. For example, you could use a moving average to confirm a trend, the RSI to measure momentum, and Fibonacci retracement to identify support and resistance levels.
Set Clear Entry and Exit Points
Using technical analysis to spot entry and exit points is essential for a solid trading plan. Be disciplined in following these signals and avoid letting emotions take control. This will ensure you minimize risk and optimize profits.
Keep an Eye on News and Events
While technical analysis focuses on charts, don’t forget to consider fundamental analysis, which looks at economic news and market events that can affect currency values. Keeping up with news, like central bank decisions or geopolitical developments, helps inform your technical analysis.
Conclusion: Master Forex Charts with Confidence
Understanding how to read and analyze forex charts is the foundation of becoming a successful forex trader. Mastering technical indicators, candlestick patterns, and market trends will allow you to make informed decisions and improve your trading performance.
Ready to enhance your trading game? Join the EPIQ Trading Floor and get access to real-time signals, expert strategies, and more. Sign up today for a 3-day free trial and start your journey toward mastering forex trading!
Disclaimer: This content is for educational purposes only and does not constitute financial advice. Always conduct your own research and consult a financial professional before making trading decisions.


Responses