

Introduction
In the world of trading, Japanese candlesticks are a fundamental tool used by traders to analyze price movements and make informed decisions. These simple yet powerful visual representations of price action have a rich history that dates back centuries. Understanding the origins and evolution of Japanese candlesticks not only adds depth to your trading knowledge but also highlights the ingenuity of early market participants. In this blog post, we’ll explore the history of Japanese candlesticks, tracing their journey from ancient rice markets to their widespread use in modern financial markets.
1. The Origins: 18th Century Japan
The story of Japanese candlesticks begins in the 18th century in Japan, during the Edo period (1603-1868). At the time, Japan was experiencing significant economic growth, and rice was the most important commodity in the country. The Dojima Rice Exchange in Osaka was the epicenter of rice trading, where rice was not just a staple food but also a form of currency and a key trading asset.
Munehisa Homma: The Father of Candlesticks
Munehisa Homma, a wealthy rice trader from Sakata, is credited with developing the candlestick charting technique. Homma was an astute observer of market psychology and recognized the importance of understanding the emotions and behaviors of other traders. He meticulously recorded the price movements of rice, noting patterns and trends that repeated over time. Through his analysis, Homma discovered that market prices were influenced not only by supply and demand but also by the emotions of traders—fear, greed, and hope.
Homma’s insights led him to develop a method for visualizing price movements, which became the foundation of Japanese candlestick charting. He documented his findings in his book “The Fountain of Gold – The Three Monkey Record of Money,” which is considered one of the earliest works on market psychology and technical analysis.
2. The Evolution of Candlestick Charting
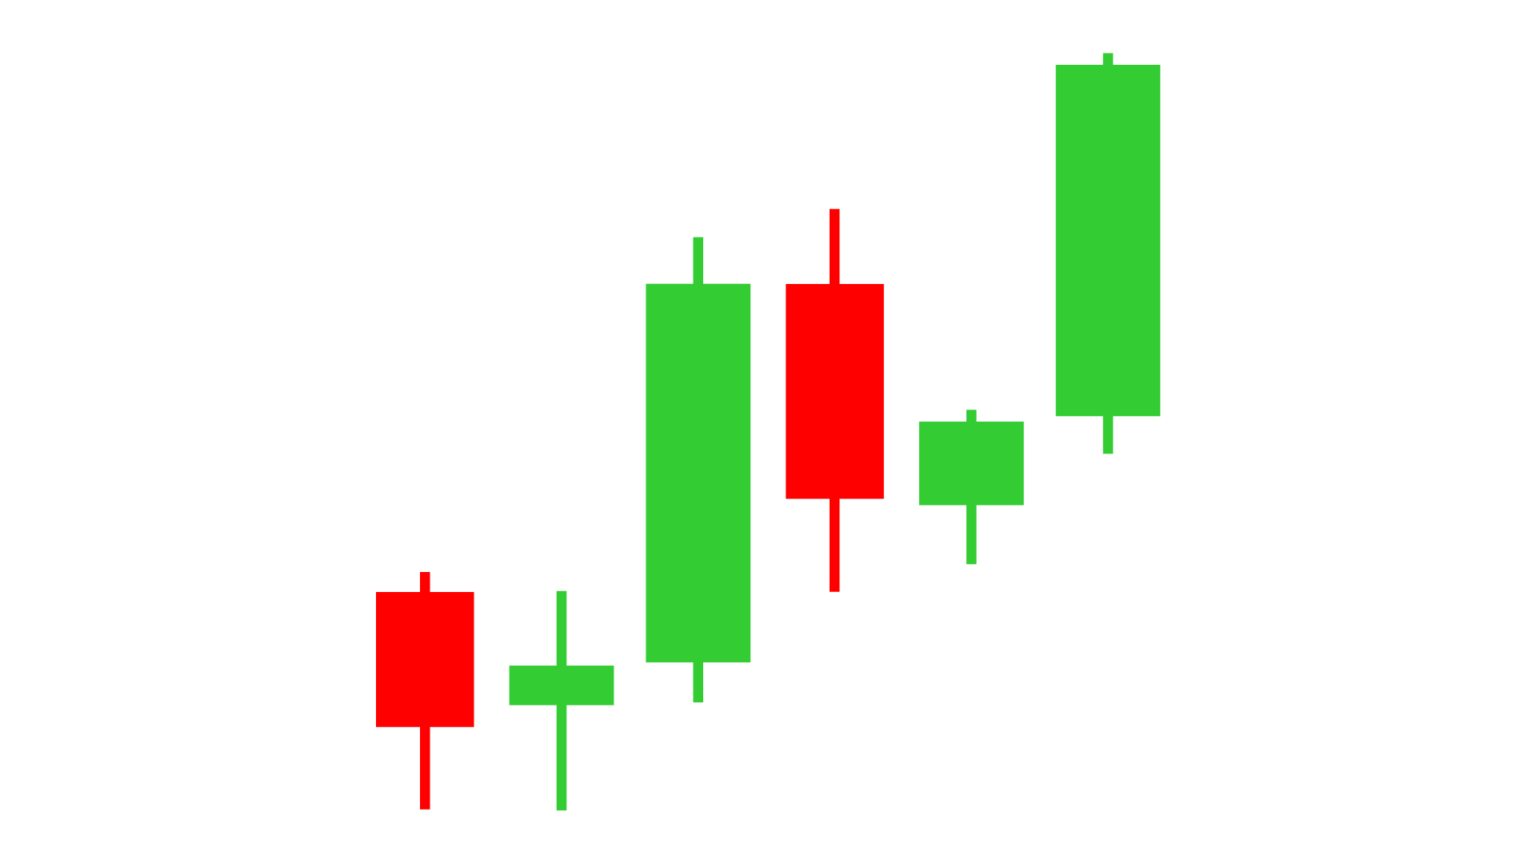
Homma’s candlestick charting method quickly gained popularity among rice traders in Japan. The charts provided a clear and concise way to visualize price movements, showing the open, high, low, and close prices for each trading period. The distinctive shapes of the candlesticks—such as the long bodies, wicks (or shadows), and the formation of patterns—helped traders identify trends, reversals, and potential market turning points.
Key Components of Candlesticks
- Body: The body of the candlestick represents the range between the opening and closing prices. A filled or colored body typically indicates a bearish period (close lower than open), while an empty or white body indicates a bullish period (close higher than open).
- Wicks/Shadows: The lines extending above and below the body represent the high and low prices during the trading period. The upper wick shows the highest price, while the lower wick shows the lowest price.
- Patterns: Over time, traders identified specific candlestick patterns that could signal future price movements. Some of the most well-known patterns include the Doji, Hammer, Shooting Star, Engulfing patterns, and the Morning and Evening Star patterns.
3. The Introduction to Western Markets
Japanese candlestick charting remained relatively unknown outside of Japan until the late 20th century. In the 1980s, Steve Nison, an American technical analyst, introduced the concept to Western traders through his research and publications. Nison’s book, “Japanese Candlestick Charting Techniques,” published in 1991, played a pivotal role in popularizing candlestick charting in global financial markets.
Nison’s work demonstrated how Japanese candlesticks could be applied to a wide range of financial instruments, including stocks, commodities, and currencies. He highlighted the effectiveness of candlestick patterns in identifying potential market reversals, continuations, and trends. As a result, candlestick charting became an essential tool for traders and analysts worldwide.
4. The Role of Candlesticks in Modern Trading
Whether you’re a day trader, swing trader, or long-term investor, candlestick charts provide a clear and immediate picture of market sentiment. The visual nature of candlesticks allows traders to quickly assess the balance of power between buyers and sellers, identify potential entry and exit points, and anticipate market movements.
Advantages of Using Candlestick Charts:
- Visual Clarity: Candlestick charts offer a clear depiction of market price action, making it easy to spot trends, reversals, and patterns at a glance.
- Versatility: Candlestick charts can be applied across different timeframes and asset classes, from one-minute charts for day trading to weekly or monthly charts for long-term investments.
- Pattern Recognition: The ability to identify candlestick patterns, such as Doji, Hammer, and Engulfing patterns, gives traders valuable insights into potential market behavior.
5. Key Candlestick Patterns Every Trader Should Know
Understanding some of the most common candlestick patterns is crucial for any trader looking to use this tool effectively. Here are a few patterns that have stood the test of time and are still widely used today:
- Doji: A Doji occurs when the opening and closing prices are nearly the same, resulting in a very small body. It signifies indecision in the market and can signal a potential reversal when found at the top or bottom of a trend.
- Hammer: The Hammer has a small body with a long lower wick, indicating that sellers pushed the price down, but buyers stepped in to drive the price back up. This pattern is often seen as a bullish reversal signal.
- Shooting Star: The Shooting Star is the opposite of the Hammer, with a small body and a long upper wick. It typically appears at the top of an uptrend and suggests a bearish reversal.
- Engulfing Patterns: These occur when a small candlestick is followed by a larger one that completely engulfs it. A Bullish Engulfing pattern (bullish reversal) occurs after a downtrend, while a Bearish Engulfing pattern (bearish reversal) follows an uptrend.
6. Candlesticks in the Context of Modern Technology
As technology has advanced, so too has the application of candlestick charts. Modern trading platforms allow traders to customize their candlestick charts with various indicators, overlays, and tools to enhance their analysis. Automated trading systems and algorithms also use candlestick patterns as part of their decision-making processes.
In addition, the widespread availability of historical data has made backtesting candlestick patterns more accessible. Traders can now test the reliability of different patterns across various markets and timeframes, refining their strategies for better results.
7. The Legacy of Japanese Candlesticks
The legacy of Japanese candlesticks is a testament to the enduring power of observation, innovation, and simplicity in the world of trading. What began as a tool for rice traders in 18th century Japan has become a cornerstone of modern technical analysis, used by millions of traders around the globe.
Candlesticks not only provide insights into price action but also embody the psychology of the market. They remind us that behind every price movement are human emotions, decisions, and reactions. By mastering candlestick charting, traders can gain a deeper understanding of market dynamics and enhance their ability to navigate the complexities of financial markets.
Conclusion
The history of Japanese candlesticks is a rich and fascinating journey that spans centuries. From their origins in the rice markets of Japan to their widespread adoption in modern financial markets, candlesticks have proven to be an invaluable tool for traders of all kinds. Understanding the history and development of candlestick charting not only enriches your trading knowledge but also provides a solid foundation for leveraging this technique in your own trading strategy.
Whether you’re a seasoned trader or just starting out, incorporating Japanese candlesticks into your analysis can give you the edge you need to make more informed trading decisions. So next time you look at a candlestick chart, remember the centuries of wisdom and innovation that have gone into perfecting this timeless tool.


Responses