

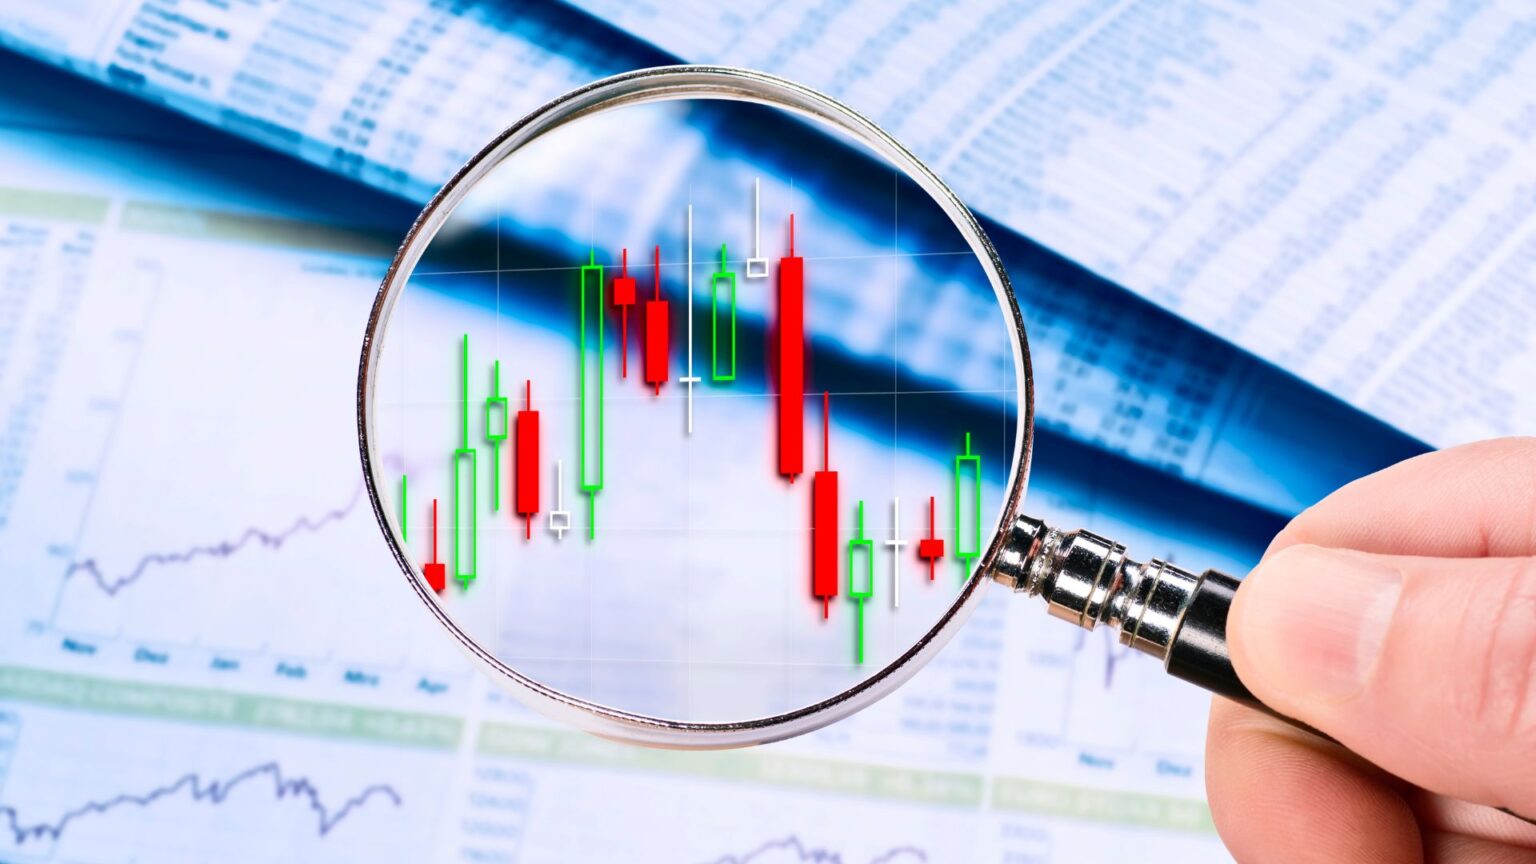
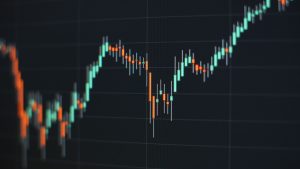
When it comes to technical analysis, understanding candlestick patterns can be an invaluable tool for traders. Whether you’re looking to identify a trend reversal or a continuation pattern, candlesticks provide a clear visual insight into market sentiment. However, combining these patterns with oscillators as confirmation can increase the accuracy of your trades. In this guide, we’ll explore some of the highest percentage candlestick patterns for both reversals and continuations, and highlight the best oscillators to use as confluence.
1. Best Candlestick Patterns for Reversals
Reversal candlestick patterns help traders identify when a trend is likely to change direction. These patterns can signal a shift from bullish to bearish or vice versa. Let’s look at the most reliable reversal patterns:
A. The Engulfing Pattern
The Engulfing Pattern is one of the most powerful candlestick patterns for identifying reversals. It consists of a small candle followed by a larger candle that fully engulfs the previous candle. A bullish engulfing pattern signals a potential bullish reversal, while a bearish engulfing pattern signals a possible bearish reversal.
- Bullish Engulfing: Appears after a downtrend, signaling a potential move higher.
- Bearish Engulfing: Appears after an uptrend, indicating a potential downward reversal.
B. The Hammer and Hanging Man
These patterns are great for spotting trend reversals, particularly when seen near support or resistance levels.
- Hammer: A hammer pattern forms after a downtrend and has a small body with a long lower wick. This shows that sellers tried to push the price lower but failed, indicating a bullish reversal.
- Hanging Man: Similar to the hammer, but forms at the top of an uptrend. It suggests a potential bearish reversal as buyers lose strength.
C. The Morning and Evening Star
The Morning Star and Evening Star are three-candle reversal patterns that are highly effective.
- Morning Star: Occurs after a downtrend and signals a bullish reversal. It consists of a bearish candle, followed by a small indecisive candle, and then a large bullish candle.
- Evening Star: Appears after an uptrend, indicating a bearish reversal with a similar formation but in the opposite direction.
Key Takeaway: These candlestick patterns are some of the highest percentage indicators of reversals. However, it’s important to confirm these signals with other technical tools to avoid false signals.
2. Best Candlestick Patterns for Continuations
Continuation patterns help traders identify when the current trend is likely to resume after a brief pause or consolidation. These patterns can keep you in winning trades longer or help you enter trending markets with better timing.
A. The Flag Pattern
The Flag Pattern is one of the most reliable continuation patterns. After a strong trend, the price consolidates in a small range, forming a flag. The breakout from this flag signals the continuation of the trend.
- Bullish Flag: Appears during an uptrend. The price consolidates briefly before continuing higher.
- Bearish Flag: Forms during a downtrend. The price consolidates in a small upward channel before continuing lower.
B. The Triangle Pattern
Triangles are another popular continuation pattern where the price consolidates in a tighter range, creating a triangle shape. Once the price breaks out of the triangle, the trend is expected to continue.
- Ascending Triangle: A bullish continuation pattern that signals a breakout to the upside.
- Descending Triangle: A bearish continuation pattern that often leads to a breakdown in price.
C. The Rising and Falling Wedge
Wedges are also great continuation patterns, but they can occasionally act as reversal signals too.
- Rising Wedge: Appears in an uptrend and typically leads to a bearish breakdown.
- Falling Wedge: Occurs in a downtrend and often signals a bullish breakout.
Key Takeaway: Continuation patterns allow traders to follow the trend and enter at the right moment after brief consolidation periods. Combining these patterns with other technical tools enhances their reliability.
3. Best Oscillators to Use as Confluence
To increase the accuracy of your trades, it’s essential to use oscillators in conjunction with candlestick patterns. These indicators help confirm whether the price movement is likely to continue or reverse.
A. The Relative Strength Index (RSI)
The RSI is one of the most commonly used oscillators for spotting overbought and oversold conditions. When the RSI is below 30, it indicates an oversold market, signaling a potential reversal to the upside. When the RSI is above 70, it suggests the market is overbought and could reverse lower.
- RSI Confluence: Use the RSI to confirm a candlestick pattern. For example, if you see a bullish engulfing pattern at a key support level and the RSI is in oversold territory, the chance of a reversal increases.
B. The Moving Average Convergence Divergence (MACD)
The MACD is a momentum oscillator that helps traders spot changes in momentum, making it ideal for confirming both continuation and reversal patterns.
- MACD Confluence: Use MACD crossovers to confirm trend direction. If the MACD line crosses above the signal line after spotting a reversal pattern, it could confirm a shift in trend.
C. The Stochastic Oscillator
The Stochastic Oscillator is another useful tool for identifying overbought and oversold conditions. It works similarly to the RSI but tends to be more sensitive, making it useful for shorter timeframes.
- Stochastic Confluence: Look for the Stochastic to move below 20 (oversold) or above 80 (overbought) to confirm a reversal or continuation signal from candlestick patterns.
Key Takeaway: Using oscillators like the RSI, MACD, and Stochastic alongside candlestick patterns increases the probability of successful trades by providing additional confirmation.
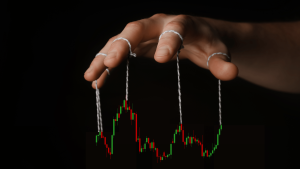
Combine Patterns and Oscillators for Optimal Results
The most successful traders know that relying on a single indicator can lead to unreliable signals. By combining candlestick patterns with oscillators, you can significantly improve your trade setups and increase your chances of success. Make sure to practice these strategies on a demo account before implementing them in live trading.
Get Real-Time Trading Signals with EPIQ Trading Floor
If you’re ready to take your trading to the next level, EPIQ Trading Floor can help. We provide real-time trading signals, expert market analysis, and a community of traders to help you make informed decisions.
With EPIQ Trading Floor, you’ll get:
- Real-time alerts on the highest-probability trading setups
- Access to professional insights and market analysis
- A community of traders sharing their experiences and strategies
Start your 3-day free trial now! Join EPIQ Trading Floor and get access to the tools and insights you need to master the markets.
Disclaimer
The information provided in this blog is for educational purposes only and should not be considered financial advice. Trading carries significant risk, and you should consult with a financial advisor before making any trading decisions.


Responses