


The cryptocurrency market is notoriously volatile, making it essential for traders to equip themselves with the right tools and knowledge. One of the most powerful tools for navigating this dynamic market is the ability to read crypto charts. These charts form the backbone of technical analysis, helping traders identify trends, predict price movements, and make data-driven decisions.
In this guide, we’ll break down the basics of crypto charts, explore the most important indicators, and share actionable tips for using technical analysis effectively.
Why Learn to Read Crypto Charts?
Crypto charts are more than just visual representations of price movements—they are key to understanding the market’s pulse. Whether you’re a beginner or a seasoned trader, learning to interpret crypto charts offers several advantages:
- Identify Trends: Recognize upward, downward, or sideways price movements.
- Spot Trading Opportunities: Enter and exit trades at the right time.
- Minimize Emotional Decisions: Base your trades on data, not speculation.
According to CoinDesk, traders who rely on technical analysis often make more consistent trading decisions compared to those who trade based on emotions or speculation.
Types of Crypto Charts
1. Line Charts
- What They Are: A simple representation of an asset’s closing prices over time.
- Best For: Long-term trend analysis and a quick overview of market direction.
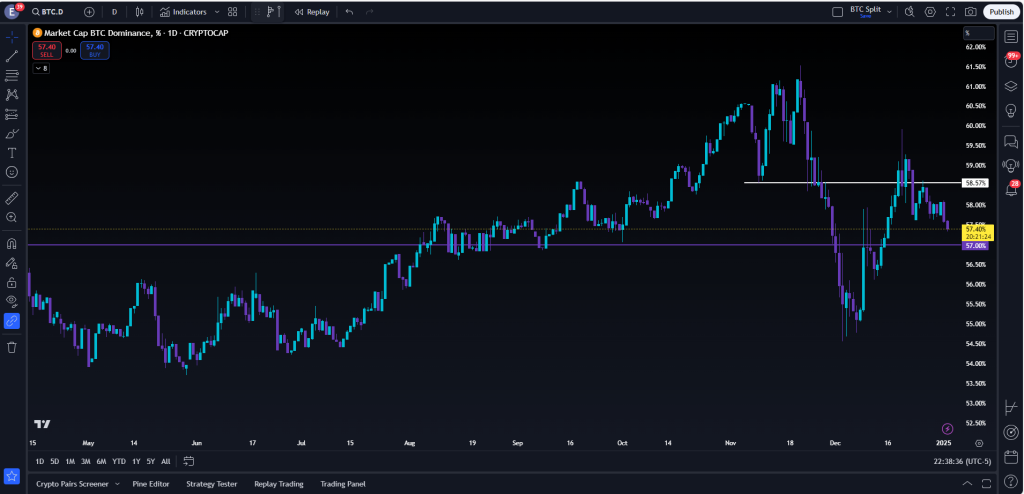
2. Candlestick Charts
- What They Are: Charts that display the opening, closing, high, and low prices of a cryptocurrency within a specific timeframe.
- Best For: Short-term trading due to their detailed representation of price movements.
3. Bar Charts
- What They Are: Similar to candlestick charts but less visually detailed.
- Best For: Understanding price ranges and market volatility.
Key Components of Crypto Charts
1. Price Levels
- Support: The price level where demand is strong enough to prevent further declines.
- Resistance: The price level where selling pressure prevents further rises.
2. Volume
Volume refers to the number of trades executed within a specific time frame. Higher volume often confirms the strength of a price trend.
3. Timeframes
Crypto charts offer various timeframes, such as 1-minute, 1-hour, daily, or weekly charts. Selecting the right timeframe depends on your trading style:
- Short-Term Traders: Use 1-minute to 1-hour charts.
- Swing Traders: Use 4-hour to daily charts.
- Long-Term Investors: Use weekly or monthly charts.
Essential Indicators for Technical Analysis
1. Moving Averages (MA)
- What It Is: A tool that smoothens price data to identify trends.
- How to Use It: Look for crossovers between short-term and long-term MAs to signal trend changes.
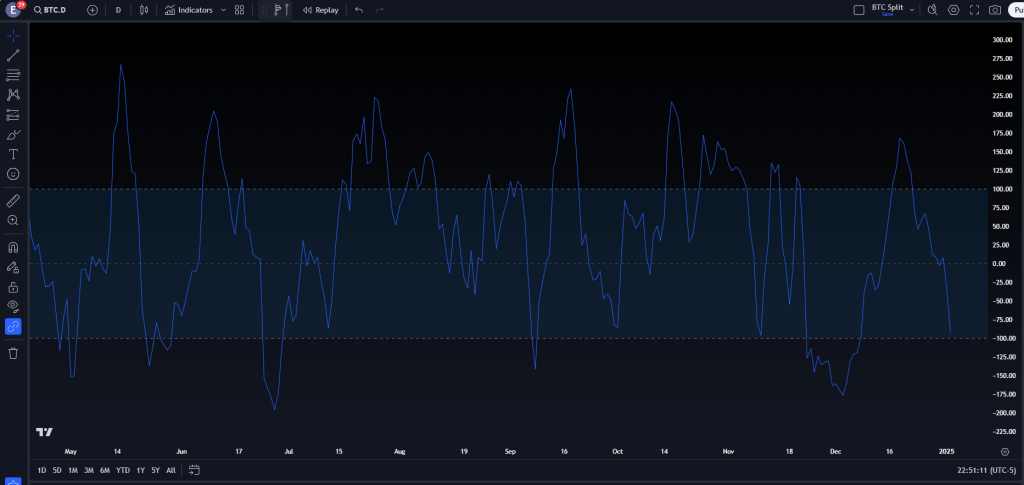
2. Relative Strength Index (RSI)
- What It Is: Measures the speed and change of price movements.
- How to Use It: Values above 70 indicate overbought conditions, while values below 30 suggest oversold conditions.
3. Bollinger Bands
- What It Is: A set of lines plotted two standard deviations away from a moving average.
- How to Use It: Use widening bands to spot high volatility and narrowing bands for potential breakouts.
4. MACD (Moving Average Convergence Divergence)
- What It Is: Tracks the relationship between two moving averages.
- How to Use It: Crossovers between the MACD line and signal line often indicate buy or sell signals.
Common Chart Patterns to Recognize
1. Head and Shoulders
- What It Indicates: A potential trend reversal.
- How to Use It: Look for the “shoulders” and “head” pattern to anticipate price drops.
2. Double Tops and Bottoms
- What It Indicates: Strong resistance (double tops) or support (double bottoms).
- How to Use It: Use these patterns to predict reversals.
3. Flags and Pennants
- What It Indicates: Continuation patterns during strong trends.
- How to Use It: Enter trades in the direction of the trend after the breakout.
Steps to Read Crypto Charts Effectively
- Choose the Right Chart Type: Start with candlestick charts for detailed analysis.
- Set Your Timeframe: Select a timeframe that aligns with your trading goals.
- Identify Key Levels: Spot support and resistance levels to plan entries and exits.
- Use Indicators: Combine tools like RSI, Bollinger Bands, and MACD to validate trends.
- Monitor Volume: Ensure price movements are backed by significant trading activity.
Leverage Advanced Tools with EPIQ Trading Floor
To enhance your chart-reading skills, access professional-grade tools at EPIQ Trading Floor. With EPIQ, you’ll benefit from:
- Customizable Charts: Tailor your charts to fit your strategy.
- Real-Time Insights: Get up-to-the-minute market data and alerts.
- Educational Resources: Learn from experts in the crypto trading space.
- Comprehensive Dashboards: Check out our crypto macro dashboard for deep market insights.
Sign up for a 3-day free trial and unlock these powerful features to elevate your trading game.
Conclusion
Reading crypto charts is a fundamental skill for navigating the volatile cryptocurrency market. By mastering chart types, indicators, and patterns, you can make smarter trading decisions and increase your chances of success.
Ready to take your trading to the next level? Join the EPIQ Trading Floor today and start your 3-day free trial. Equip yourself with the tools and insights needed to thrive in the dynamic world of crypto trading.
Disclaimer: The information provided in this blog is for educational purposes only and does not constitute financial advice. Cryptocurrency trading involves significant risk, and you should consult with a financial advisor before making investment decisions.


Responses