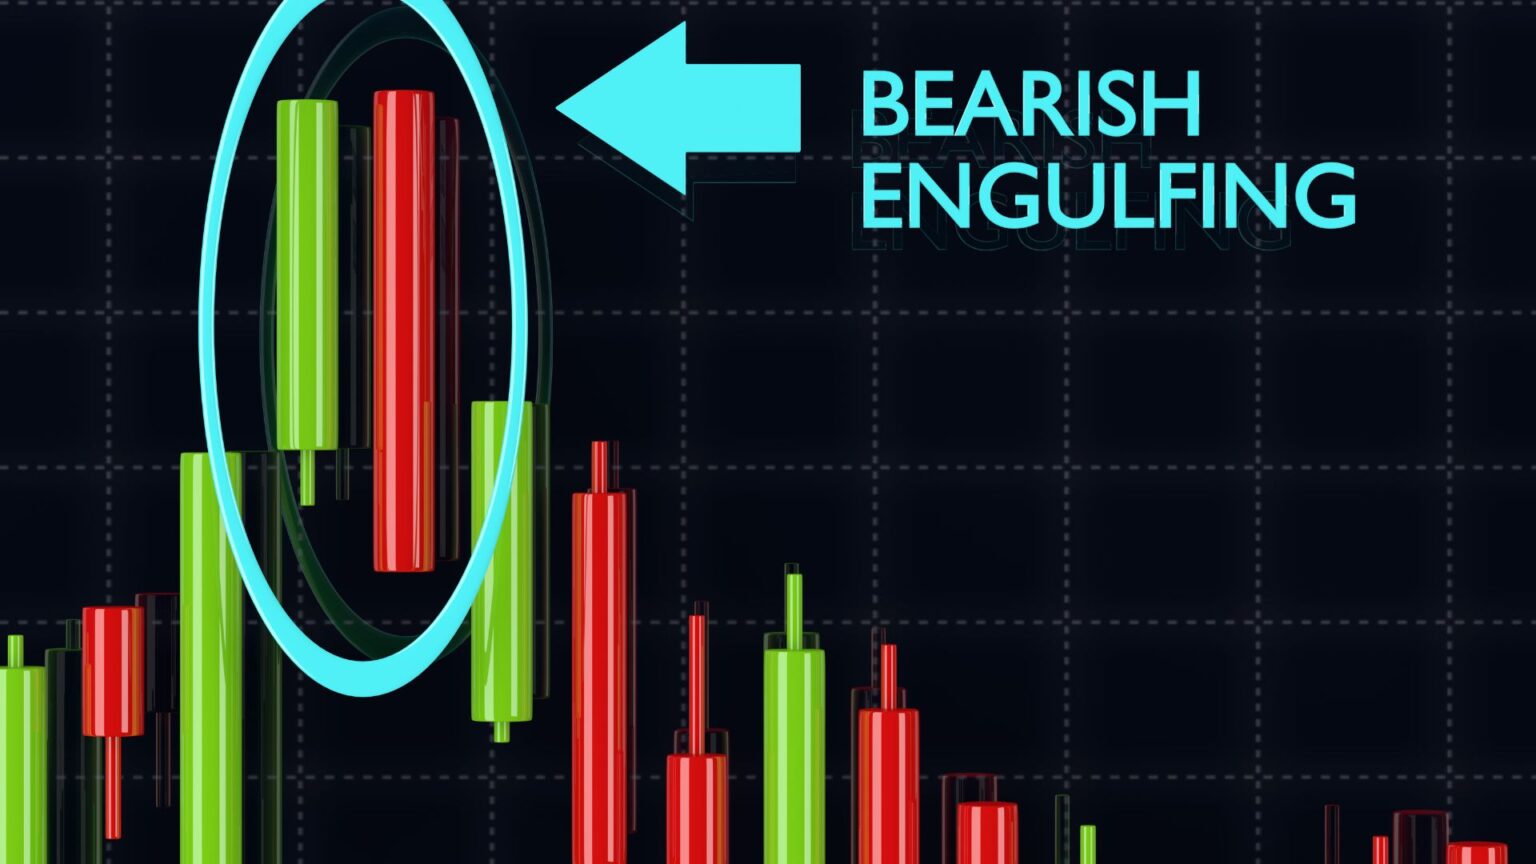
Candlestick patterns are one of the most popular tools used by traders to analyze price action and make informed decisions. They provide valuable insight into market sentiment, giving traders a visual representation of the battle between buyers and sellers. However, for new traders just learning how to read candlestick patterns, there are some common pitfalls that can lead to costly mistakes.
In this blog post, we’ll explore three of the most common mistakes that new traders make when using candlestick patterns and provide practical solutions to avoid these errors. Whether you’re just getting started or looking to improve your trading game, these tips will help you make more informed and accurate trading decisions.
1. Mistake #1: Misinterpreting Candlestick Patterns in Isolation
The Problem:
One of the biggest mistakes new traders make is relying too heavily on individual candlestick patterns without considering the broader market context. Traders might spot a bullish engulfing pattern, for example, and immediately assume that the market will go up. However, candlestick patterns should never be used in isolation.
The Solution:
To avoid this mistake, it’s important to use candlestick patterns in conjunction with other forms of technical analysis, such as support and resistance levels, moving averages, and volume indicators. By looking at the bigger picture, you can confirm whether a candlestick pattern is signaling a genuine trend reversal or if it’s just a temporary fluctuation.
Key Takeaway: Always consider the overall market context before acting on a candlestick pattern. Look for confluence with other indicators to validate the signal.
For more insights on how to combine candlestick patterns with other technical analysis tools, check out this guide on technical indicators.
2. Mistake #2: Ignoring Timeframes
The Problem:
Another common mistake is ignoring the importance of timeframes when analyzing candlestick patterns. New traders often focus on a single timeframe, such as the 1-hour or 4-hour chart, without considering how patterns on different timeframes interact with each other. As a result, they may miss important signals or interpret short-term fluctuations as long-term trends.
The Solution:
To avoid this mistake, it’s crucial to practice multi-timeframe analysis. This means looking at the same candlestick pattern across multiple timeframes—such as the daily, 4-hour, and 1-hour charts. A pattern that appears bullish on a lower timeframe might be part of a larger bearish trend on a higher timeframe. By using multiple timeframes, you can gain a clearer and more accurate picture of the market.
Key Takeaway: Always check multiple timeframes when analyzing candlestick patterns. This will help you filter out noise and identify stronger, more reliable signals.
Learn more about multi-timeframe analysis and its importance in this article.
3. Mistake #3: Overtrading Based on False Signals
The Problem:
Candlestick patterns can generate a lot of signals, but not all of them are reliable. New traders often fall into the trap of overtrading, acting on every single pattern they spot without considering the quality of the signal. This can lead to false breakouts, whipsaws, and ultimately, losses.
The Solution:
To avoid overtrading, focus on quality over quantity. Look for high-probability setups that are confirmed by other technical indicators or fundamental analysis. Additionally, it’s important to set risk management rules, such as stop-loss orders, to protect your capital in case the market moves against you.
Before entering a trade, ask yourself:
- Is this candlestick pattern confirmed by other indicators?
- Is the overall trend in my favor?
- What is my risk-reward ratio for this trade?
By being selective and sticking to a disciplined trading strategy, you can avoid chasing every candlestick pattern and falling victim to false signals.
Key Takeaway: Avoid overtrading by focusing on high-probability setups and using confirmation signals from other technical tools.
Leverage Candlestick Patterns and More with EPIQ Trading Floor
Candlestick patterns can be powerful tools when used correctly, but they require practice, patience, and the right strategies to master. If you’re looking to improve your trading skills and make the most of candlestick patterns, EPIQ Trading Floor is here to help.
With EPIQ Trading Floor, you’ll get:
- Real-time trading signals and insights to help you spot reliable candlestick patterns.
- Access to expert analysis on key market movements, including candlestick patterns, technical indicators, and more.
- A supportive community of traders to share strategies, ideas, and experiences.
Start your 3-day free trial today! Join EPIQ Trading Floor and take your trading to the next level with real-time market insights and a community of experts.
Disclaimer
The information provided in this blog is for educational purposes only and does not constitute financial advice. Always conduct your own research before making any investment decisions.


Responses