


As of May 19, 2025, the total cryptocurrency market capitalization stands at approximately $3.20 trillion, reflecting a modest daily decline of –3.42%. This figure represents the combined value of all cryptocurrencies, including Bitcoin, Ethereum, and altcoins.
🧠 What Is the Crypto Total Market Cap?
The crypto total market cap measures the total value of all cryptocurrencies combined. It provides a macro-level view of the cryptocurrency market’s size and growth. Monitoring this metric helps traders and investors understand overall market trends, investor sentiment, and potential shifts between different types of digital assets.
🔍 Current Market Indicators
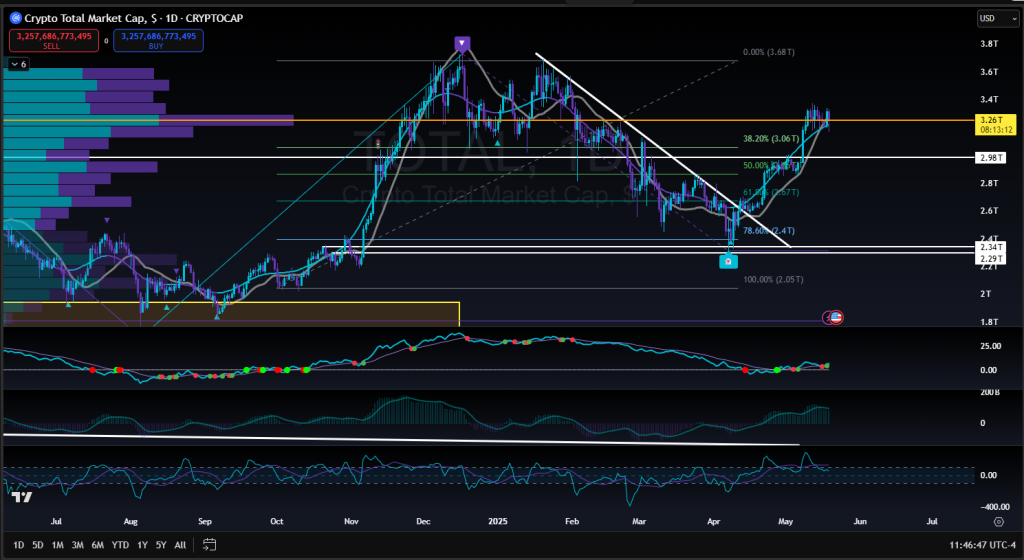
📈 Relative Strength Index (RSI): 58.42
The RSI is a momentum oscillator that measures the speed and change of price movements. It ranges from 0 to 100:
- Above 70: Overbought (potential price correction)
- Below 30: Oversold (potential price increase)
An RSI of 58.42 suggests that the market is in a neutral zone, recovering from recent oversold conditions. This indicates a balanced momentum without immediate signs of being overbought or oversold .
📊 Exponential Moving Averages (EMAs)
- 20-day EMA: $3.14T
- 50-day EMA: $2.92T
- 100-day EMA: $2.94T
- 200-day EMA: $2.84T
The market cap trading above all key EMAs indicates a short-term bullish sentiment. EMAs help identify the trend direction, and being above these averages suggests upward momentum .
📉 Understanding Overbought Conditions
An asset is considered overbought when its price has risen significantly in a short period, potentially leading to a price correction. Indicators of an overbought market include:
- High RSI values (above 70)
- Prices significantly above EMAs
- Rapid price increases without corresponding fundamental support
Currently, with an RSI of 58.42 and prices above key EMAs, the market is not in an overbought condition, but it’s essential to monitor these indicators for any rapid changes.
🔄 Potential Opportunities
Understanding market conditions can help identify trading opportunities:
- Breakout Traders: If the market cap breaks above the $3.14T resistance (20-day EMA), it may signal a continuation of the upward trend, presenting buying opportunities.
- Pullback Traders: A pullback towards the $3.0T support level could offer entry points for those looking to buy at lower prices.
- Risk Management: Always set stop-loss orders to manage potential downturns, especially if the market shows signs of reversing.
🧠 Final Thoughts
The crypto market as of May 19, 2025, shows a neutral to slightly bullish sentiment. While not overbought, the market’s position above key EMAs and a moderate RSI suggest potential for growth. Traders should monitor resistance levels and RSI for signs of overbought conditions and be prepared for possible corrections.
🎯 Want to Stay Ahead of Every Crypto Market Move?
Inside EPIQ Trading Floor All-Access Mentorship, we break down real-time market data like $TOTAL, $BTC.D, and sector-specific flows — so you always know when to rotate, when to wait, and when to strike.
You’ll get:
✅ Live macro dashboards for crypto, forex, and stocks
✅ Trade alerts based on structure, volume, and momentum
✅ A full crypto trading academy to help you grow from beginner to pro
✅ Weekly livestreams where we chart moves together in real time
✅ A social platform built for traders — by traders
🎯 Start your 3-day free trial now → epiqtradingfloor.com
Know the structure. Catch the move. Trade with confidence.
⚠️ Disclaimer:
This blog is for educational purposes only and does not constitute financial advice. Always conduct your own research and consult with a financial advisor before making investment decisions.


Responses