

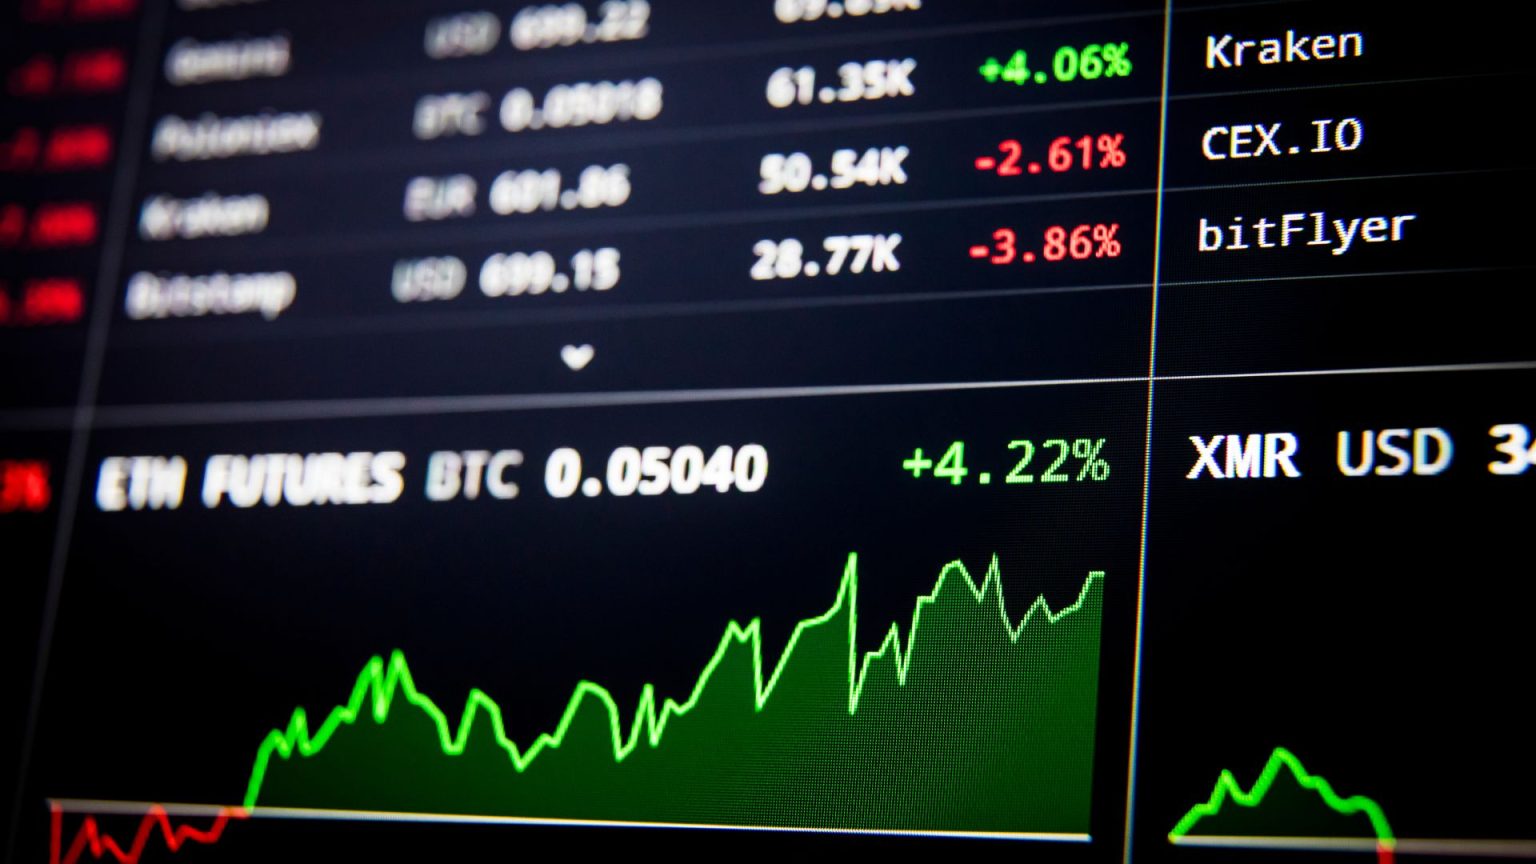
Charts might look intimidating, red and green candles flying everywhere, indicators crossing, numbers flashing.
But once you understand the basics, charts become your roadmap to the market.
Here’s how to read crypto charts clearly, even if it’s your first day trading.
🕯 Step 1: Understand Candlesticks
Each candlestick represents price movement within a specific time frame (1m, 5m, 1H, 4H, 1D, etc.).
A candle shows four key data points:
- Open: Where price started
- Close: Where price ended
- High: The highest price reached
- Low: The lowest price reached
Colors:
- 🟢 Green Candle: Price closed higher than it opened (bullish)
- 🔴 Red Candle: Price closed lower than it opened (bearish)
📉 Step 2: Identify Trends
Markets move in three main directions:
- Uptrend: Higher highs, higher lows
- Downtrend: Lower highs, lower lows
- Sideways: Range-bound consolidation
Use trendlines or moving averages (like the 50 EMA) to spot which phase the market is in.
📊 Step 3: Learn Support and Resistance
Support = where price often bounces up (buyers step in)
Resistance = where price often rejects (sellers step in)
If price breaks resistance, that level can flip into support — a concept known as an S/R flip.
These zones help you identify entries, exits, and reversals.
🔍 Step 4: Add Volume
Volume shows how strong a move is.
If price rises with high volume, buyers are confident.
If price moves on low volume, the move may be weak or fake.
⚙️ Step 5: Use Indicators (But Don’t Overuse Them)
For beginners, start simple:
- RSI (Relative Strength Index): Tells if price is overbought or oversold.
- MACD: Measures momentum and potential reversals.
- Moving Averages (MA/EMA): Show trend direction and dynamic support/resistance.
One or two indicators are enough. Don’t overload your chart.
🧠 Step 6: Combine It All
Example:
- BTC is above the 50 EMA (trend up).
- RSI shows healthy momentum (not overbought).
- Price breaks resistance with volume and retests it successfully.
✅ That’s a strong, confluence-based setup.
🚫 Common Chart Reading Mistakes
- Drawing too many lines — simplicity wins.
- Ignoring higher timeframes — zoom out for structure.
- Entering based on emotion — wait for confirmation.
- Forgetting risk management — no chart is perfect.
🎯 Final Thoughts
Reading charts is like learning a language.. At first, it’s confusing, but soon it becomes second nature.
Once you master the basics, every candle tells a story, and you’ll start seeing opportunity where others see noise.
Learn to Read Charts Like a Pro with EPIQ
At EPIQ Trading Floor, you’ll get:
✅ Daily BTC/ETH chart breakdowns with annotations
✅ Lessons on structure, volume, and momentum
✅ AI chart assistant that highlights key support/resistance zones automatically
✅ A free 3-day trial to start learning hands-on
👉 Join EPIQ today and turn your chart confusion into trading confidence.
NFA: This article is for educational purposes only and not financial advice. Always do your own research and manage your risk responsibly.


Responses