

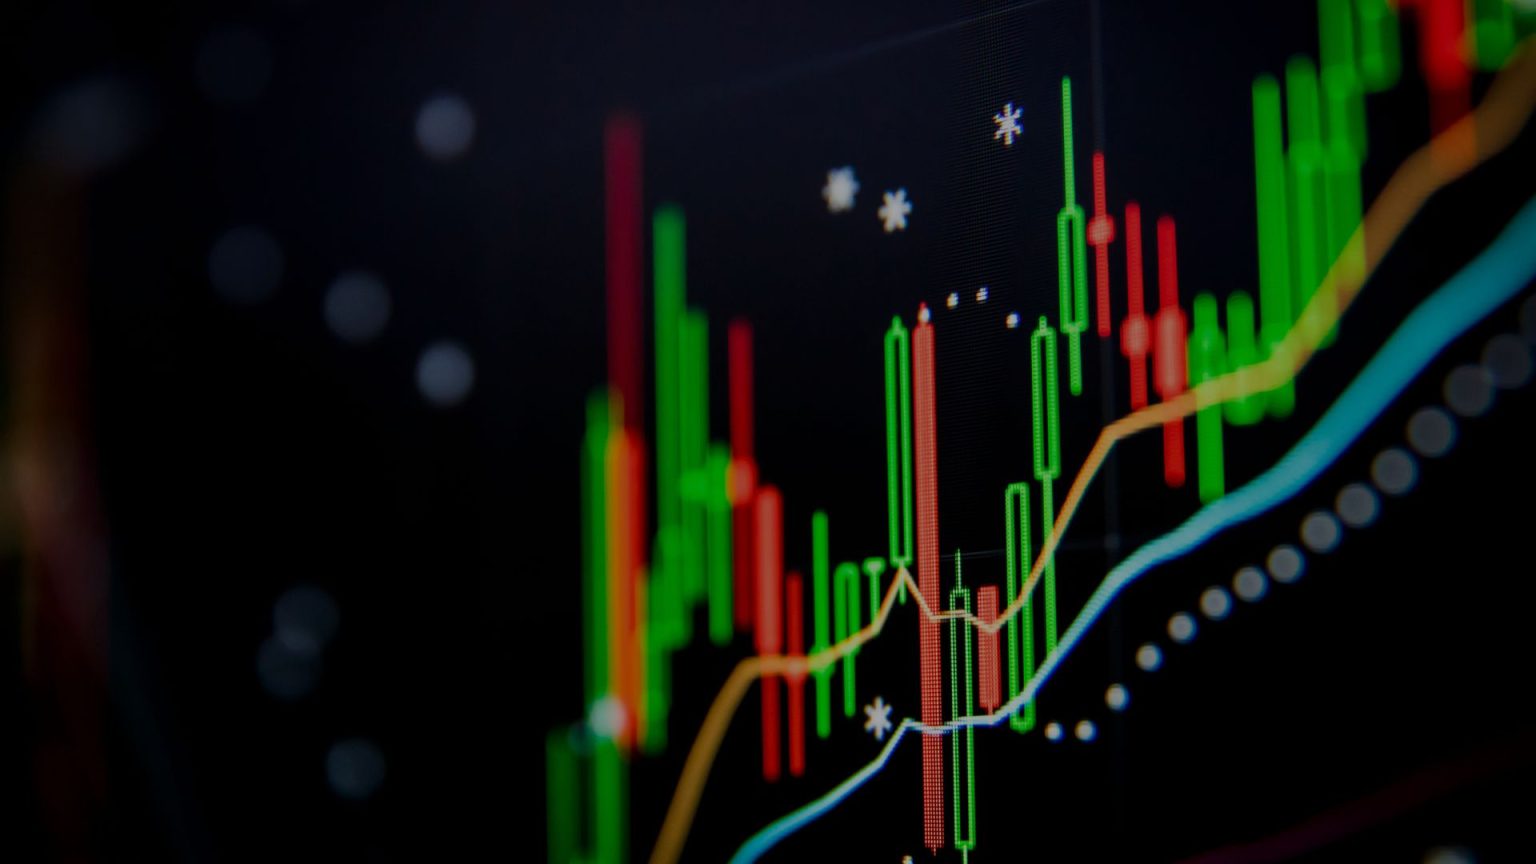
If you’ve ever pulled up a Bitcoin chart and felt completely lost staring at red and green candles, you’re not alone. Almost every new trader starts here, confused, frustrated, and wondering if technical analysis (TA) is just magic.
The truth is, candlestick charts aren’t as complicated as they look. With a little guidance, you can learn to spot key patterns, recognize important levels, and trade with confidence. Let’s break down candlesticks step by step, without the overwhelm.
Candlestick Basics: What Those Red and Green Bars Mean
Each candlestick represents a block of time (like 1 minute, 1 hour, or 1 day), and shows four things:
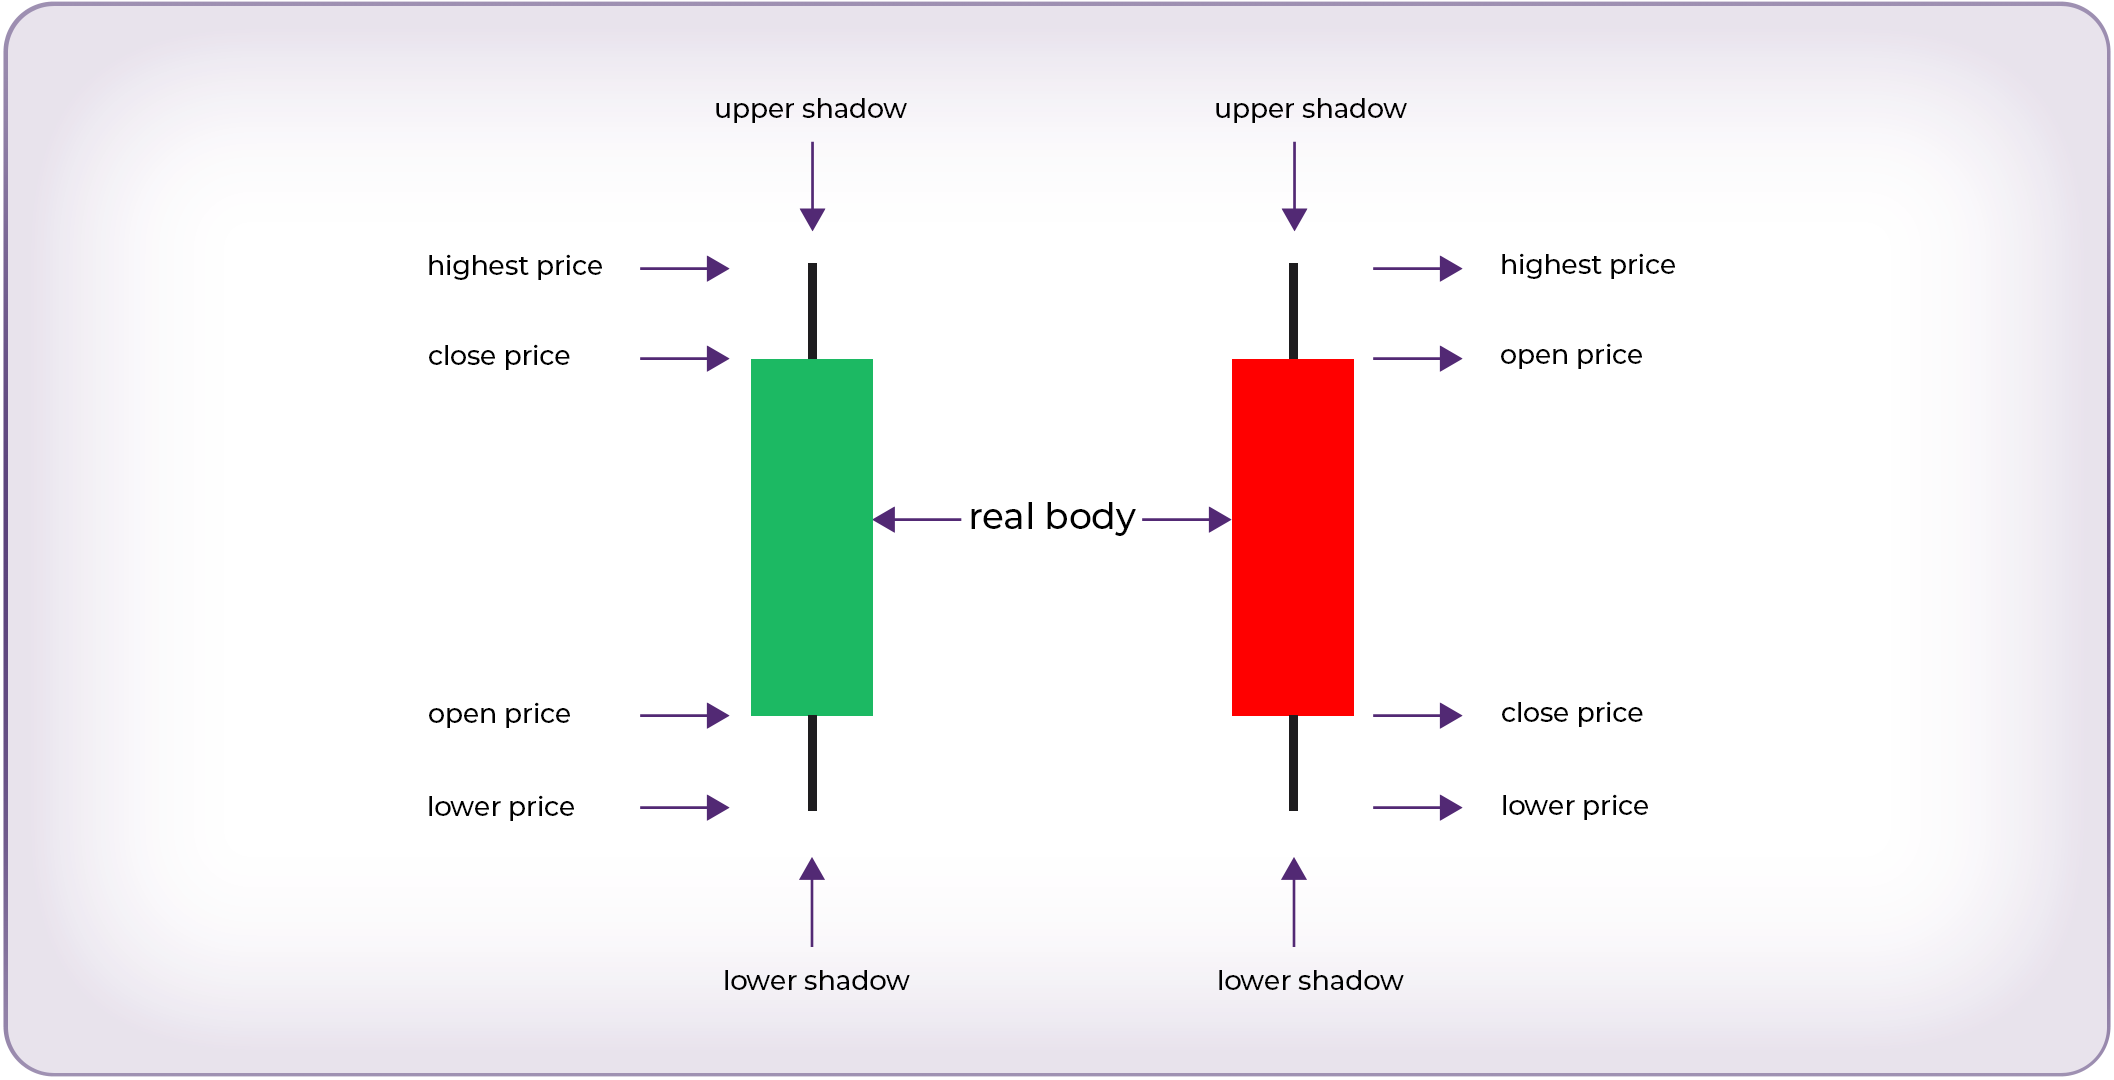
- Open: The price when the candle started.
- Close: The price when the candle ended.
- High: The highest price during that time.
- Low: The lowest price during that time.
- A green candle = price closed higher than it opened (bullish).
- A red candle = price closed lower than it opened (bearish).
The body of the candle shows the range between open and close. The wicks (or shadows) show how far price moved above or below during that time.
📌 Example: A long wick on the bottom of a green candle often signals buyers stepping in after sellers pushed price down.
Support and Resistance in Bitcoin Trading

Before you dive into fancy chart patterns, you need to understand support and resistance:
- Support: A price level where Bitcoin tends to “bounce” back up (buyers step in).
- Resistance: A level where Bitcoin often stalls or reverses down (sellers take profit).
These levels form natural barriers in the market. Traders watch them closely because:
- Breaking above resistance = bullish continuation.
- Breaking below support = bearish continuation.
Tip: Look left on the chart. Areas where price has reversed multiple times are strong zones of support or resistance.
Simple Chart Patterns Every Beginner Should Know

While pros use dozens of advanced patterns, beginners should focus on just a few high-probability setups:
1. Flags (Bull or Bear Flags)
- A strong price move, followed by a small consolidation channel.
- Usually leads to continuation in the original direction.
2. Triangles (Ascending/Descending/Symmetrical)
- Price squeezes between support and resistance, forming a triangle.
- The breakout direction often sets the next big move.
3. Double Bottoms
- Price tests a support level twice and fails to break lower.
- Often signals a bullish reversal after a downtrend.
Learning these three patterns alone will help you catch some of Bitcoin’s biggest moves.
Mistakes Beginners Make With Technical Analysis
- Using too many indicators → Cluttered charts = conflicting signals. Stick to 2–3 tools.
- Forcing patterns → Not every move is a “perfect” flag or triangle. Be patient.
- Ignoring volume → Price without strong volume behind it is weak. Confirm moves with volume.
- Overtrading → Just because you see candles moving doesn’t mean you need to trade. Wait for clear setups.
- No risk management → Even the best chart setups fail sometimes. Always use stop losses.
Final Thoughts
Reading candlestick charts is the foundation of trading Bitcoin. You don’t need to memorize 50 patterns or use ten indicators, just learn the basics, master support and resistance, and practice spotting simple setups.
With time, the “noise” of the chart will start to make sense, and you’ll see opportunities more clearly.
Ready to Simplify Trading?
At EPIQ Trading Floor, we make chart reading easier for beginners:
- Daily breakdowns of Bitcoin and altcoin charts
- Step-by-step guides for spotting support/resistance
- AI-powered chart analysis so you can compare your own setups
- A community that helps you avoid the common mistakes most beginners make
👉 Start your 3-day free trial today and trade with confidence, not confusion.
Disclaimer: This post is for educational purposes only and not financial advice. Always do your own research before trading.


Responses