

If you’re just stepping into the world of crypto trading, it can feel like trying to read a foreign language made of lines, colors, and candlesticks. But here’s the truth: you don’t need 20 indicators to trade successfully. You just need to understand a few key ones really well.
Technical indicators are tools that help traders analyze price action and predict future movement. While no indicator is 100% accurate, they help stack the odds in your favor, especially when used with proper risk management and a solid trading strategy.
In this guide, we’re breaking down the top 5 most important indicators every beginner in crypto should know in 2025. These are the building blocks of smart, confident trading, and they work across all timeframes and market conditions.
1. 📊 Volume – The Most Underrated Tool
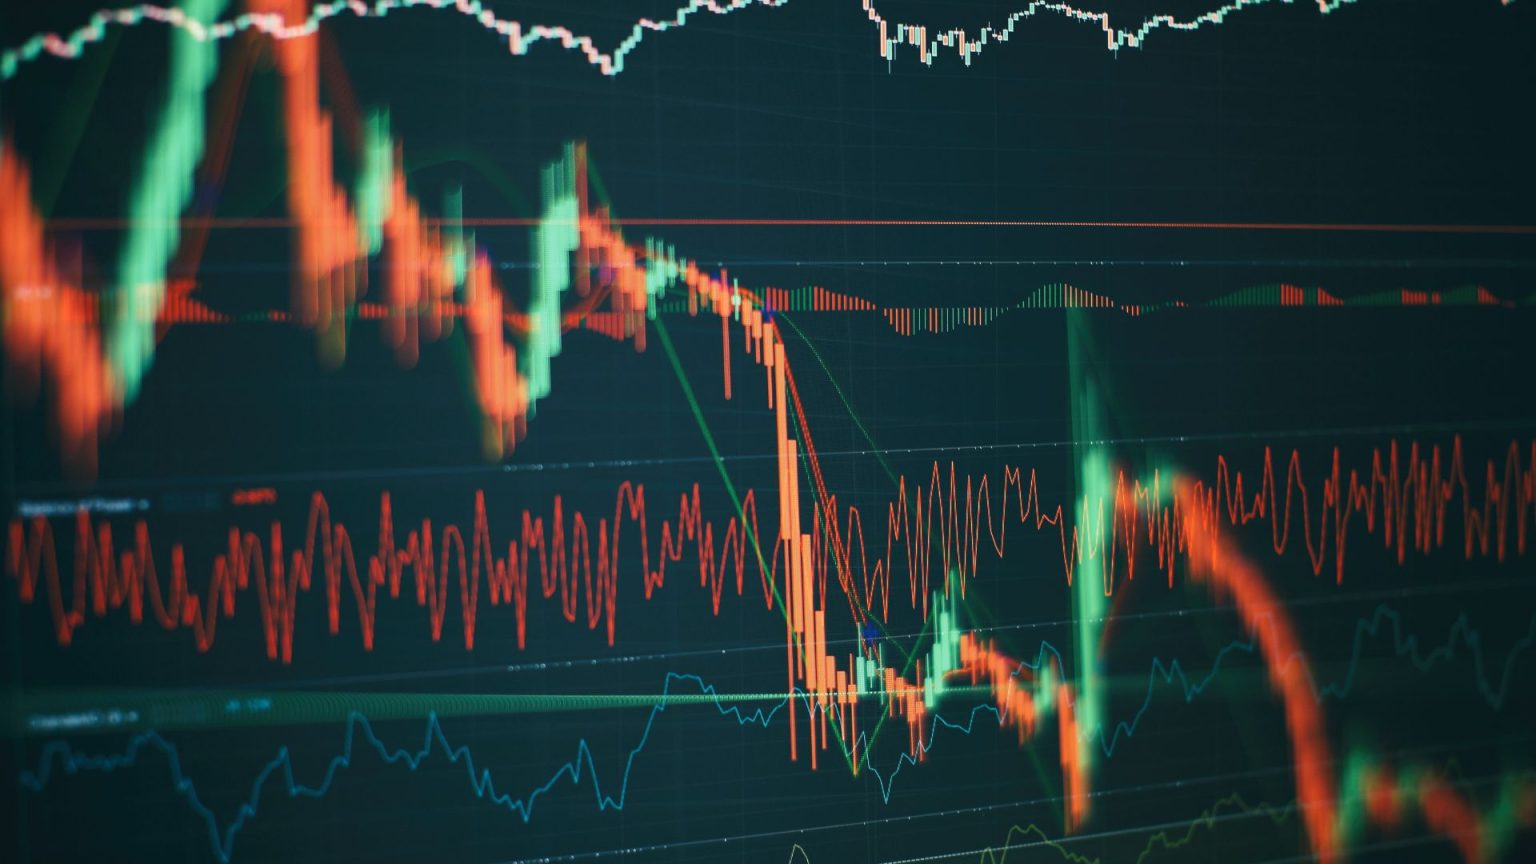
What it is: Volume measures how much of an asset is being traded over a certain time. It tells you how strong or weak a move is.
Why it matters: A price pump with high volume is strong. A breakout with low volume? Probably fake.
How to use it:
- Confirm breakouts: If price breaks resistance but volume is low, it’s likely a trap.
- Spot reversals: A sharp spike in volume near key support/resistance may signal a reversal.
- Monitor whale activity: Volume heatmaps show where large buys/sells are happening.
💡 Pro tip: At EPIQ Trading Floor, we use volume confluence to confirm our signals. It’s one of the most important indicators in our system.
2. 🟡 RSI (Relative Strength Index) – Spot Overbought & Oversold Zones
What it is: RSI measures the strength of recent price movements. It ranges from 0 to 100.
Why it matters: It helps identify when an asset may be due for a reversal.
Key levels:
- Overbought: RSI > 70 = possible pullback
- Oversold: RSI < 30 = possible bounce
How to use it:
- Combine with support/resistance for better entries.
- Look for RSI divergence, when price makes a new high but RSI doesn’t. This often signals reversal.
3. 📈 Moving Averages (MA) – Spot the Trend
What it is: A moving average smooths out price data to show the trend over time.
Why it matters: Helps identify the direction and strength of a trend.
Common types:
- SMA (Simple Moving Average): Best for long-term analysis (e.g., 50, 200 SMA)
- EMA (Exponential Moving Average): More sensitive to recent price (e.g., 8, 21 EMA)
How to use it:
- Trend confirmation: Price above 200 EMA = bullish. Below = bearish.
- Golden/Death crosses: When short MA crosses above long MA = bullish signal.
4. 🧠 Market Structure – Read the Flow of Price
What it is: Market structure is the sequence of higher highs and higher lows (uptrend) or lower highs and lower lows (downtrend).
Why it matters: This is the core of all technical analysis. Understand structure, and everything else becomes easier.
How to use it:
- Identify break of structure (BoS) for trend change signals
- Use supply and demand zones based on structure for sniper entries
- Combine with volume and RSI for high-probability trades
5. 🔮 Fibonacci Retracement – Catch the Pullback
What it is: A tool that helps identify potential levels where price could retrace before continuing.
Why it matters: Markets don’t move in straight lines. They pull back, and that’s where opportunity lies.
Key levels:
- 0.382, 0.5, 0.618: Most common retracement zones
- 0.786: Deeper pullback, still bullish continuation
How to use it:
- Draw fibs from swing low to swing high (or vice versa)
- Combine with RSI or volume to confirm if the pullback is ending
- Use it to plan entries, stop losses, and take profit zones
🚨 Important Note:
Indicators should never be used in isolation. They are tools, not signals on their own. The best trades come from confluence: when multiple factors align (e.g., structure, volume, and RSI).
Ready to Master These Indicators?
You can spend months learning all this alone… or you can shortcut your growth by joining the EPIQ Trading Floor, the first true social media platform built for traders.
Inside, you’ll get:
✅ Live trades with volume-based strategies
✅ Educational videos on RSI, structure, and fib levels
✅ 3-day free trial to test our systems, signals & tools
✅ Community of experienced traders to learn with
✅ Crypto dashboard with volume heatmaps and sentiment
✅ Full access to Section 1 of our Trading Academy (100% free)
👉 Click here to join the EPIQ Trading Floor now, where beginners become confident, and confident traders become profitable.
⚠️ Disclaimer
This blog is for educational purposes only and does not constitute financial advice. Always do your own research and consult a professional before investing.


Responses