

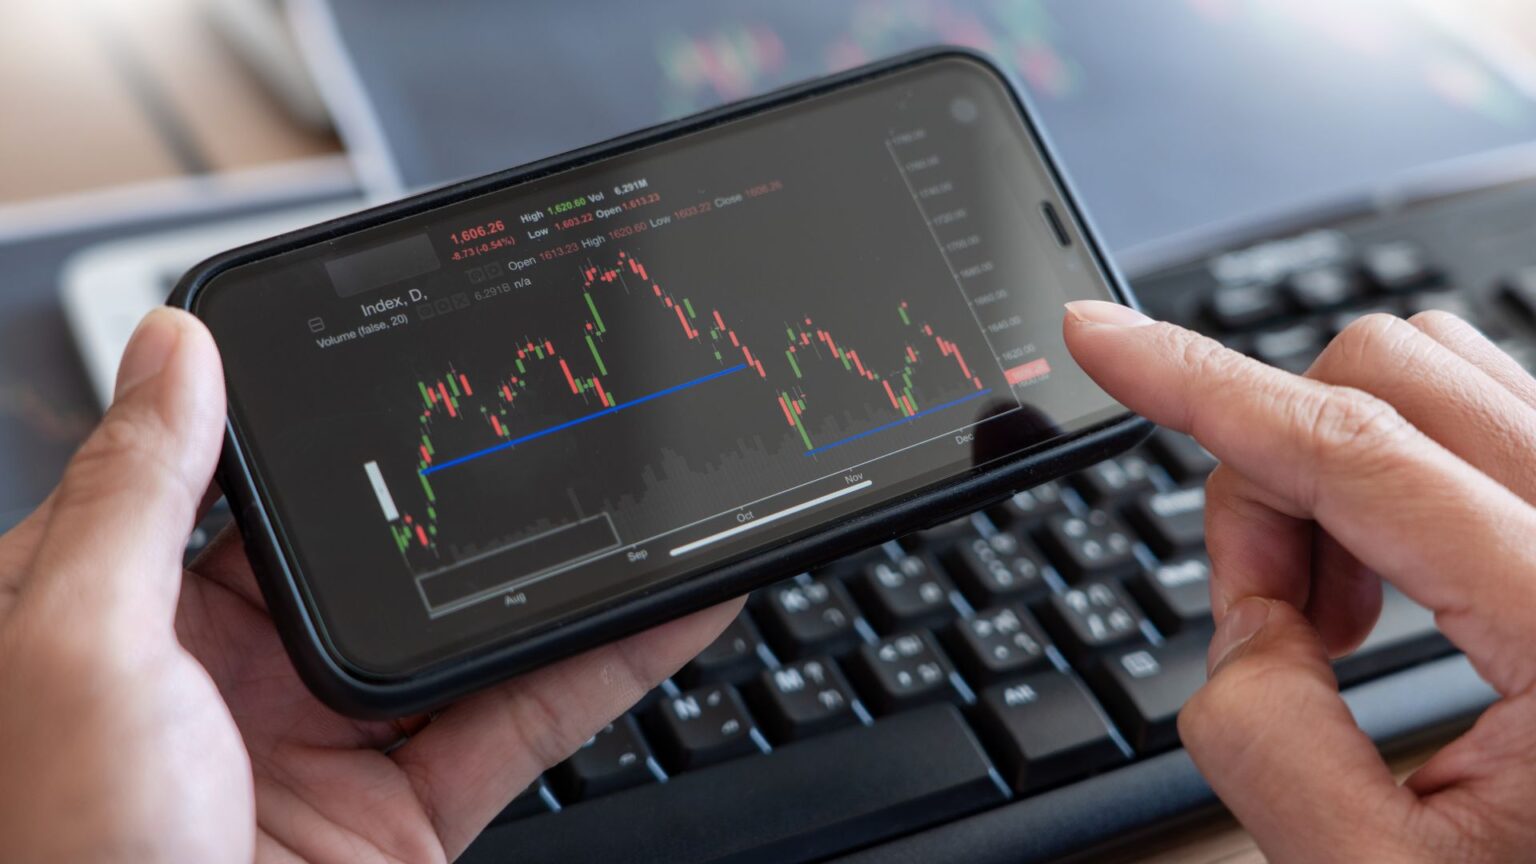
Technical analysis focuses on price charts, volume, and other historical data to predict future market movements. Unlike fundamental analysis, which considers a coin’s underlying technology or team, technical analysis relies solely on patterns and indicators visible in the charts.
Using technical analysis effectively requires discipline, practice, and the ability to interpret various indicators in combination rather than relying on any single data point.
Key Indicators for Crypto Technical Analysis
Moving Averages (MA)
Moving Averages (MA) are essential in identifying the overall trend of an asset. MAs smooth out price data over a set period, providing a clearer view of the trend direction by reducing “noise.”
- Simple Moving Average (SMA): A basic form of MA that averages closing prices over a specific period. Traders use SMAs to determine if the price is trending upward or downward.
- Exponential Moving Average (EMA): Places more weight on recent data, making it more responsive to current price changes. This is helpful in volatile markets like crypto, where recent trends might carry more significance.
Pro Tip: Look for the Golden Cross (short-term MA crosses above long-term MA) and the Death Cross (short-term MA crosses below long-term MA) to identify potential bullish or bearish movements.
Relative Strength Index (RSI)
The Relative Strength Index (RSI) measures the speed and change of price movements, helping traders understand if an asset is overbought or oversold.
- RSI Value: Typically, an RSI above 70 indicates that the asset is overbought, potentially signaling a price correction. Conversely, an RSI below 30 suggests that the asset may be oversold and due for a rebound.
Pro Tip: Use RSI alongside trend indicators. For instance, if a downtrend is coupled with an oversold RSI, this could signal a buying opportunity.
Moving Average Convergence Divergence (MACD)
The Moving Average Convergence Divergence (MACD) is a trend-following momentum indicator that shows the relationship between two moving averages. The MACD line (difference between two EMAs) and the Signal Line (9-day EMA of the MACD line) reveal potential buy and sell signals.
- Signal: When the MACD crosses above the Signal Line, it can indicate a bullish momentum. Conversely, when the MACD falls below the Signal Line, it can suggest a bearish shift.
Pro Tip: Use MACD in combination with RSI to confirm market momentum and avoid false signals.
Bollinger Bands
Bollinger Bands consist of a moving average with two standard deviation lines above and below it, indicating volatility. These bands expand during volatile market periods and contract during stable periods.
- Usage: When prices touch the upper Bollinger Band, the market may be overbought; when they touch the lower band, it may be oversold.
Pro Tip: During a strong trend, the price may “ride the band,” staying near the upper or lower boundary. Use caution and consider other indicators to confirm the trend.
Volume Analysis
Volume is a vital indicator of trading activity. Analyzing volume alongside price trends provides insight into market strength or weakness.
- Volume Spikes: Significant volume increases can precede price breakouts. For example, rising volume on a price breakout suggests that the move has momentum and may be sustained.
Pro Tip: Confirm breakouts and breakdowns by checking for higher-than-average volume to reduce the risk of false signals.
Combining Indicators for Stronger Analysis
Using a combination of these indicators helps to reduce the likelihood of false signals and increase the accuracy of your analysis. Here’s how to create a powerful approach:
- Identify the Trend: Use Moving Averages to determine the direction of the trend.
- Check Momentum: Add RSI and MACD to gauge the momentum and confirm the trend’s strength.
- Analyze Volatility: Utilize Bollinger Bands to see if the market is in a high-volatility state.
- Verify with Volume: Confirm all moves with volume analysis for greater confidence.
Benefits of Technical Analysis in Crypto Trading
- Timely Entries and Exits: Technical analysis allows you to identify precise entry and exit points.
- Objective Decision-Making: Using technical data can reduce the emotional bias common in crypto trading.
- Adaptable to All Timeframes: You can apply these indicators to different timeframes, allowing flexibility based on your trading style, whether it’s day trading, swing trading, or long-term investing.
Common Mistakes in Technical Analysis
Avoid these common pitfalls to maximize the benefits of technical analysis:
- Over-Reliance on a Single Indicator: No single indicator tells the whole story. Use a combination to create a complete analysis.
- Ignoring Market News: Technical analysis is powerful, but external events and market news can still impact prices.
- Emotional Trading: Technical analysis aims to eliminate emotional bias. Stick to your strategy and avoid impulsive decisions.
Ready to Enhance Your Technical Analysis Skills?
Want to take your crypto trading to the next level? Join EPIQ Trading Floor and gain access to advanced trading tools, signals, and a community of seasoned traders. Get a 3-day free trial to experience the full power of EPIQ, where you’ll find real-time insights and support for all your trading needs.
By mastering technical analysis and understanding these key indicators, you’ll be better equipped to make informed trading decisions. Start integrating these tools into your analysis, and over time, your confidence and success in the crypto markets can grow significantly.
Disclaimer: This post is for educational purposes only and should not be considered financial advice. Always consult a financial advisor and conduct thorough research before trading.


Responses