

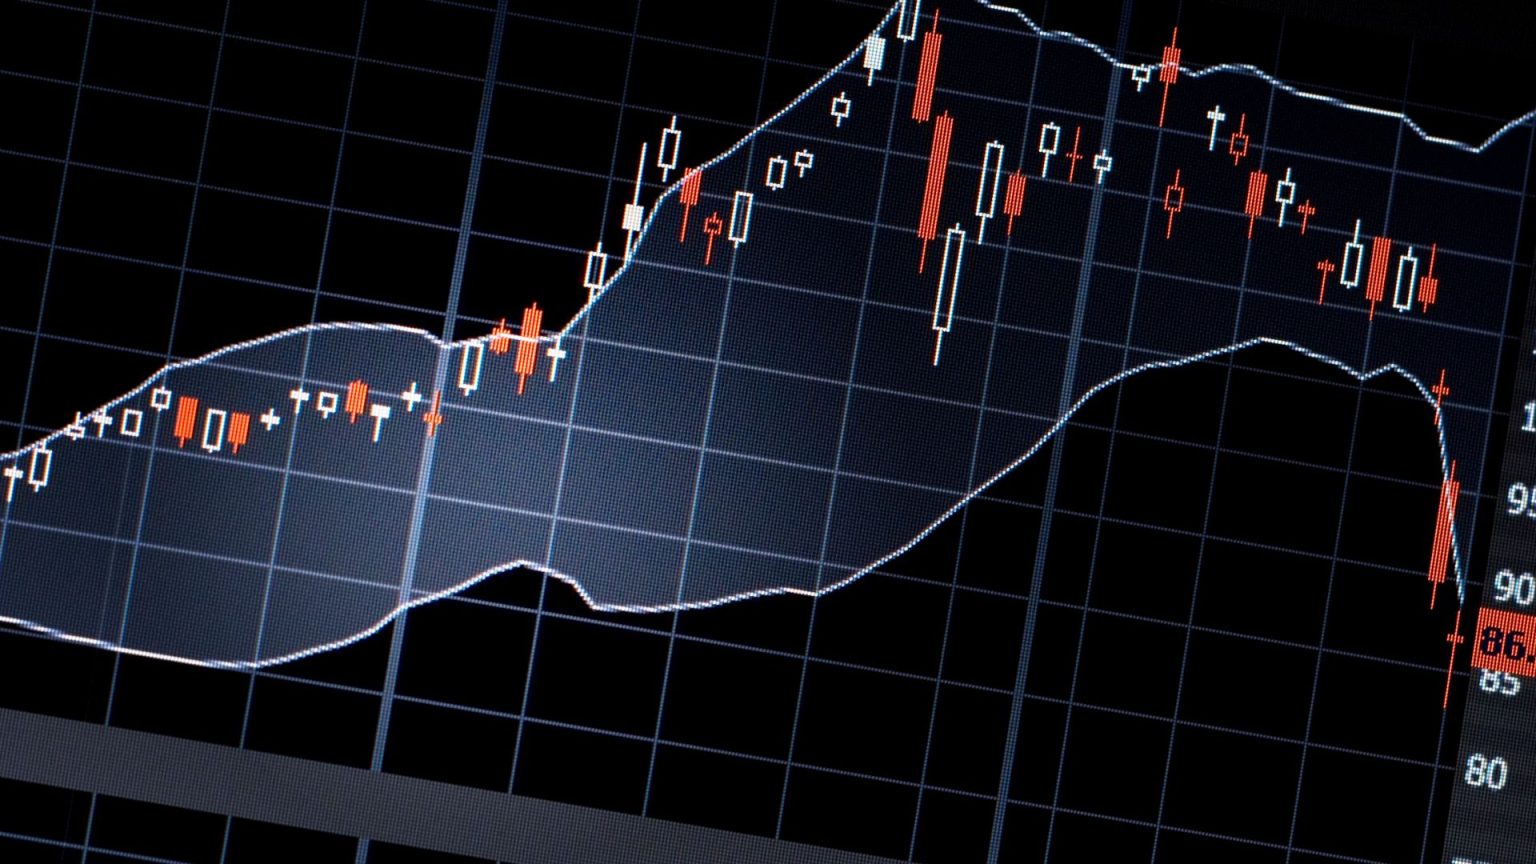
If you’ve ever wondered why price suddenly reverses right when everyone’s bullish — or why your short gets blown out just as the chart looks perfect — the answer might lie in two metrics most beginners ignore: funding rates y open interest.
These two data points are among the most powerful signals in crypto trading because they tell you what the crowd is doing, and more importantly, when the crowd is about to get punished.
Once you learn how to read them, you’ll start seeing traps and liquidations forming antes de they happen.
Let’s break down how they work and how you can use them to trade smarter and avoid emotional decisions.
⚙️ What Are Funding Rates?
Funding rates are periodic payments exchanged between long and short traders in perpetual futures markets.
Perpetuals (or “perps”) don’t expire like traditional futures, so exchanges use funding rates to keep their contract prices close to the spot price.
- When funding rates are positivo, longs pay shorts.
- When funding rates are negative, shorts pay longs.
En términos sencillos:
Funding shows which side of the market is more crowded and more confident — and that’s often the side most at risk of being squeezed.
📈 Why Funding Rates Matter
Funding rates are like a real-time sentiment index for futures traders.
When everyone is bullish and piling into longs, funding rates skyrocket.
That means traders are literally paying a premium to stay long — a major warning sign that euphoria is peaking.
When everyone’s bearish and shorting aggressively, funding rates turn negative.
That’s usually when markets are close to bottoming out, because shorts are overcrowded.
Ejemplo:
- BTC funding +0.12% (very high): Market is euphoric — potential long squeeze incoming.
- BTC funding -0.10% (very low): Market is fearful — potential short squeeze brewing.
It’s not about the absolute number — it’s about the extreme conditions. When funding gets too high or too low, the market often snaps the other way.
📊 What Is Open Interest (OI)?
Open interest is the total number of active futures contracts that haven’t been closed or settled.
Think of it as the amount of “money in the game.”
When open interest increases, new money is entering the market. When it decreases, traders are closing positions or getting liquidated.
Por qué es importante:
- Rising OI with rising price = new money entering longs (potentially bullish until it overheats).
- Rising OI with falling price = new shorts opening (potentially bearish until shorts overcrowd).
- Falling OI after a sharp move = liquidations or exits (a possible signal that the move is exhausting).
By combining open interest with funding rates, you can get a clear picture of where the pressure is building — and when a reversal might be coming.
🧠 How to Combine Funding Rates + Open Interest for Market Insight
Scenario 1: Funding High + OI Rising
- Traders are overly bullish and opening new longs.
- Often signals greed and potential long squeeze ahead.
Scenario 2: Funding Negative + OI Rising
- Traders are piling into shorts, expecting more downside.
- Often signals fear and potential short squeeze.
Scenario 3: Funding Neutral + OI Dropping
- Traders are closing positions.
- The market is cooling off — low conviction and reduced volatility.
Scenario 4: Extreme Funding Flip
- When funding quickly shifts from highly positive to negative (or vice versa), it signals a sentiment reversal.
- These flips often happen near local tops and bottoms.
⚡ How to Use This Data in Real Time
- Track Funding Across Exchanges
- Check average funding rates on major exchanges like Binance, Bybit, and OKX.
- If one exchange has extreme rates, it can create arbitrage opportunities or hint at where retail is trapped.
- Monitor Open Interest Heatmaps
- Many tools (like Coinglass, Hyblock, and EPIQ dashboards) visualize OI spikes.
- Pay attention to OI clusters near major price levels — they’re liquidation zones waiting to trigger.
- Watch for Divergence
- If price is going up but OI is dropping, the move is likely being driven by short covering — not genuine buying strength.
- If price is going down but OI is dropping, the selling pressure might be exhaustion rather than trend continuation.
- Look for “Reset” Moments
- When funding resets to neutral after being extreme, it’s often a sign the market has flushed leverage.
- That’s when real trend moves can start.
💡 Pro Example: Spotting a Squeeze Early
Let’s say Bitcoin funding is +0.15% and open interest has spiked 10% in the past 24 hours.
Price is moving up, but volume is weakening. That means the rally is being fueled by leverage, not spot demand.
An experienced trader would start:
- Taking partial profits or tightening stops.
- Watching for signs of liquidation clusters on the heatmap.
- Waiting for a flush or squeeze before re-entering.
A few hours later, one red candle wipes out the late longs, funding resets, and price stabilizes again.
That’s how professionals trade con the market, not against it.
🧩 Avoiding the Retail Trap
Retail traders often ignore funding and OI because they seem too “technical.” But the truth is, these metrics are the heartbeat of leveraged markets.
If you’re trading without them, you’re basically flying blind in a storm of liquidation data and institutional manipulation.
Smart traders use them to:
- Avoid entering into crowded positions.
- Spot hidden reversals early.
- Time entries after liquidity resets.
🎯 Reflexiones finales
The market doesn’t move randomly — it moves strategically, through liquidity and leverage cycles.
Funding rates and open interest are your roadmap to understanding those cycles.
Once you master how to read them, you’ll stop reacting emotionally and start anticipating the next move like a pro.
Opere de forma más inteligente con EPIQ
En Parqué EPIQ, we help traders use advanced data like funding, OI, and liquidation levels to trade intelligently — not emotionally.
En el interior, obtendrá:
✅ Real-time dashboards tracking funding, OI, and volume shifts
✅ Educational guides on reading market sentiment
✅ AI-powered chart breakdowns with confluence zones
✅ 24/7 access to a community of disciplined, data-driven traders
Start today and take control of your trading — before the market takes control of you.
Asesoramiento no financiero (NFA): This content is for educational purposes only and not financial advice. Always do your own research and manage your risk responsibly.


Respuestas