

If you’re new to trading, one of the first (and most powerful) concepts you need to understand is soporte y resistencia. These two simple ideas form the backbone of technical analysis, helping you identify where price is likely to pause, reverse, or break out.
Whether you trade crypto, forex, stocks, or futures, understanding support, resistance, and S/R flips will give you a massive edge in spotting high-probability setups and improving your entries and exits.
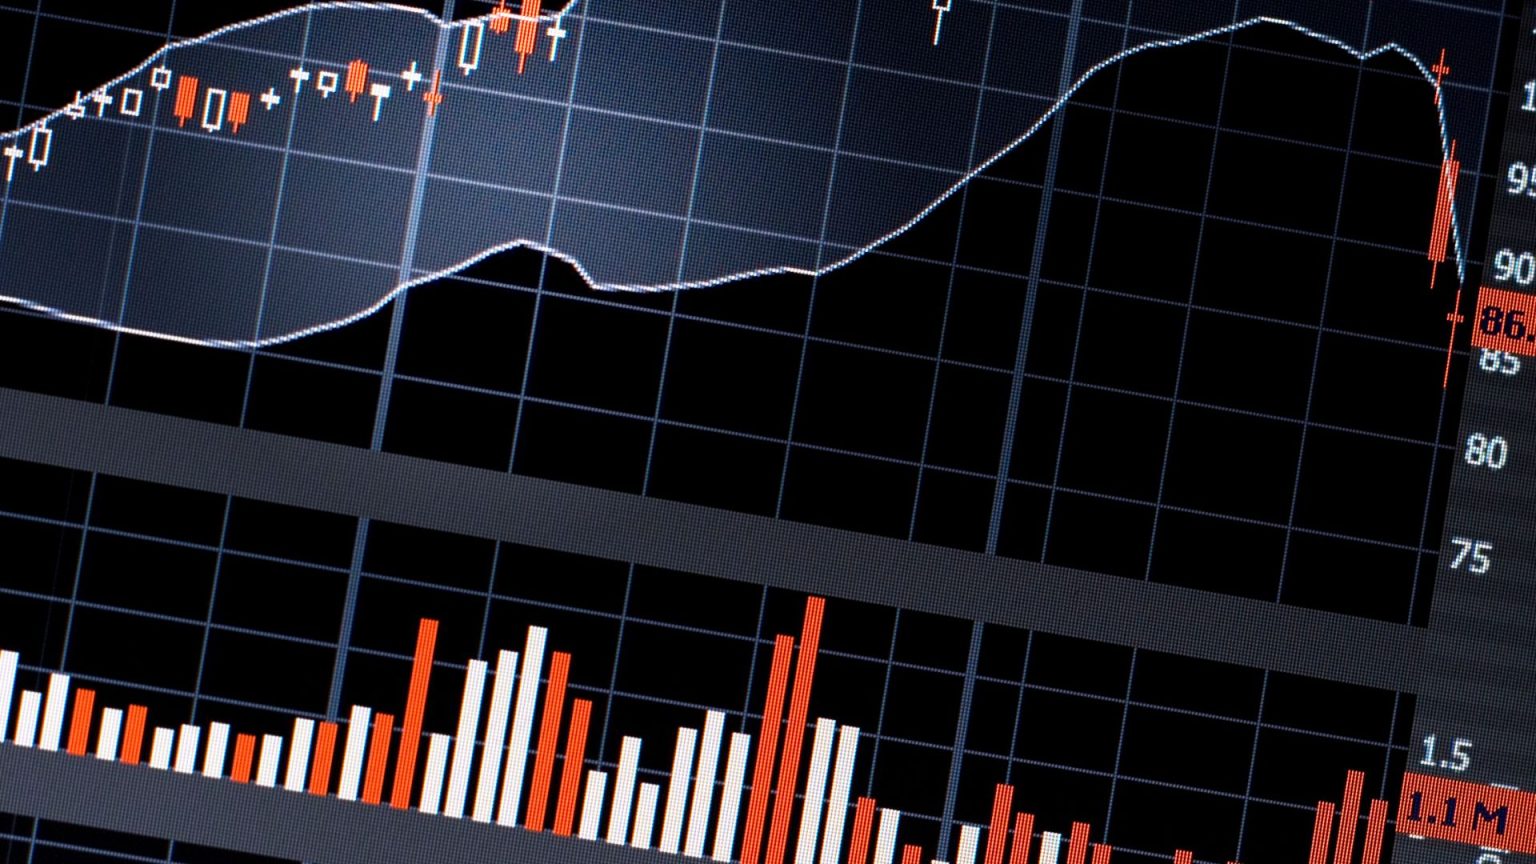
🧠 What Are Support and Resistance Levels?
🔹 Support
Support is a price level where demand (buyers) tends to step in, preventing the market from falling lower.
Think of it as a “floor” that catches price when it drops.
When price hits support and bounces, it means traders see value there, creating a reaction zone.
Ejemplo:
Bitcoin drops to $60,000 multiple times but keeps bouncing — that $60,000 level becomes a key support zone.
🔹 Resistance
Resistance is the opposite — it’s a price level where supply (sellers) tends to appear, preventing the market from rising higher.
Es el “ceiling” that price struggles to break through.
Ejemplo:
Ethereum keeps rallying to $4,000 but fails to push higher, $4,000 becomes a strong nivel de resistencia.
📊 Why These Levels Matter
Support and resistance aren’t magic, they’re reflections of psicología del mercado:
- Ayuda forms when buyers consistently defend a level.
- Resistencia forms when sellers take profit or short at the same level repeatedly.
They’re critical because they help you:
✅ Time entries and exits
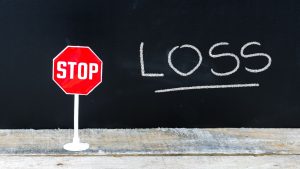
✅ Set stop losses logically
✅ Identify reversals vs. breakouts
✅ Spot areas where big players are active
Once you understand how these levels form, you can start reading the market like a map instead of guessing where it’s going.
🔄 What Is an S/R Flip (Support/Resistance Flip)?
One of the most powerful price behaviors traders use is the Support/Resistance Fliptambién conocido como “role reversal.”
Here’s how it works:
- En support breaks, it often turns into resistance.
- En resistance breaks, it often turns into support.
This happens because traders who missed the initial move wait for price to retest that level, creating new reactions at the same area.
Ejemplo:
- Bitcoin breaks above $60,000 resistance → retests $60,000 → buyers step in → it becomes support.
- Later, if Bitcoin falls below $60,000 again → sellers defend it → it becomes resistance.
This flip confirms market structure shifts, a change in control between buyers and sellers.
⚙️ How to Identify Support and Resistance Levels
Here’s a simple system you can use on any chart:
1. Look for Repeated Reaction Points
Mark horizontal zones where price has reversed or stalled multiple times.
The more touches, the stronger the level.
2. Combine with Volume
Strong support or resistance often shows spikes in trading volume, signaling that major players are active there.
3. Check Multiple Timeframes
Support and resistance from higher timeframes (Daily, 4H, Weekly) carry more weight than short-term intraday levels.
4. Use Round Numbers
Humans tend to react around big psychological levels — like $1,000, $10,000, or $100,000. These often act as natural barriers.
5. Confirm with Candlestick Clues
Busque wicks, engulfing patterns, or rejection candles near these levels, they tell you price reacted and rejected that zone.
🎯 How to Trade Support and Resistance
1. Bounce Setup
Wait for price to approach a level and show rejection.
Enter with confirmation (like a bullish engulfing candle at support).
Use the recent low/high as your stop loss.
2. Breakout Setup
If price breaks through resistance with strong momentum and volume, wait for a retest (S/R flip) — then enter on confirmation.
3. Negociación por rangos
When price is stuck between clear support and resistance, you can buy at the bottom and sell near the top — until a breakout happens.
4. Confluence Strategy
Combine S/R levels with other tools — like moving averages, RSI, or trendlines — for stronger confirmation.
⚠️ Mistakes Beginners Often Make
- Drawing Too Many Lines – Keep it simple. Focus on key reaction zones, not every minor bounce.
- Forcing Levels – If you can’t clearly see the level without squinting, it’s probably not significant.
- Ignoring Volume or Context – Always confirm a breakout or bounce with momentum.
- Buying Directly Into Resistance – Wait for confirmation or a clean breakout instead of guessing.
- Not Waiting for Retests – Patience pays. The best trades come after retests, not random entries.
💪 Pro Tip: Watch for S/R Flips on High Timeframes
S/R flips on the 4H, diario y semanal charts are often where the biggest moves start.
These levels are where institutional traders and whales make their entries.
If you see a clean breakout followed by a successful retest — that’s your confirmation of a potential trend continuation.
📈 Reflexiones finales
Support and resistance are the most fundamental concepts in trading, simple, yet extremely powerful.
If you can learn to recognize these zones and trade patiently around them, you’ll immediately separate yourself from 90% of new traders who rely purely on emotion.
Acuérdate:
- Support = buyers defending
- Resistance = sellers defending
- S/R flip = change in control
Once you master these, your trading confidence and consistency will skyrocket.
Opere de forma más inteligente con EPIQ
En Parqué EPIQ, we help traders understand how to apply these concepts in real-time — not just theory.
Inside EPIQ, you’ll get:
- ✅ Live chart breakdowns highlighting key support/resistance zones
- ✅ Real-time alerts on S/R flips and breakout setups
- ✅ Educational lessons inside the EPIQ Academy (beginner to advanced)
- ✅ A private trader community that reviews setups together daily
👉 Comienza tu Prueba gratuita de 3 días and learn how to master structure, timing, and risk like a pro — not a guesser.
Asesoramiento no financiero (NFA): This content is for educational purposes only and should not be considered financial or investment advice. Always perform your own analysis and trade responsibly.


Respuestas