


If you’re new to cryptocurrency trading, understanding how to read charts is crucial. Charts help you analyze market trends, identify potential entry and exit points, and make informed decisions. This guide will introduce you to the basics of crypto chart analysis.
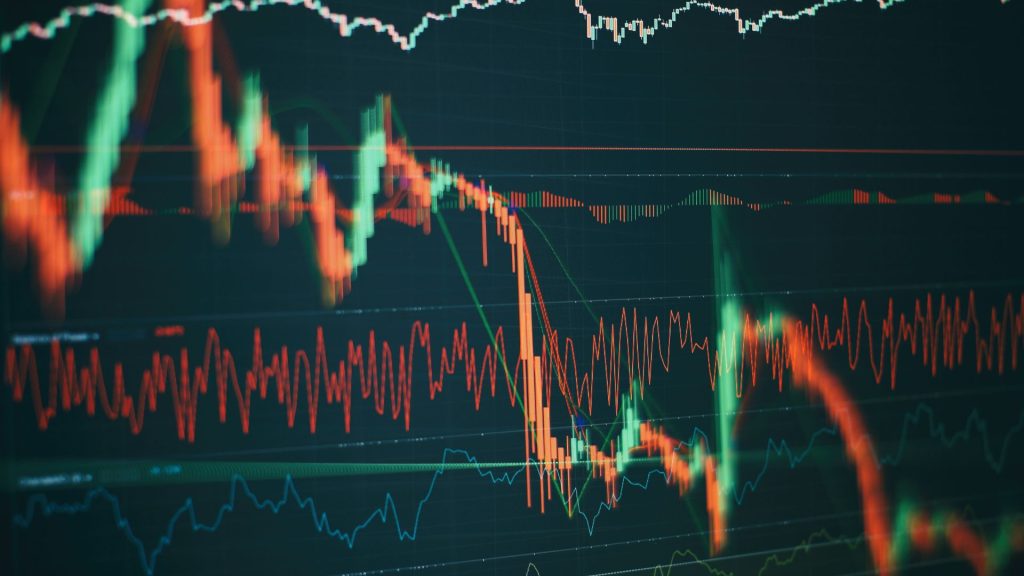
📊 Understanding Candlestick Charts
Candlestick charts are the most commonly used charts in crypto trading. Each candlestick represents a specific time frame (e.g., 1 hour, 1 day) and shows four key pieces of information:
- Open Price: The price at the beginning of the time frame.
- Close Price: The price at the end of the time frame.
- High Price: The highest price during the time frame.
- Low Price: The lowest price during the time frame.
The body of the candlestick shows the range between the open and close prices, while the wicks (or shadows) indicate the high and low prices.
📈 Identifying Trends
Recognizing market trends is essential for making strategic trades.
- Uptrend: A series of higher highs and higher lows, indicating a bullish market.
- Downtrend: A series of lower highs and lower lows, indicating a bearish market.
- Sideways Trend: When the price moves within a horizontal range, showing market indecision.
Use trendlines to connect the highs and lows, helping you visualize the direction of the market.
🛠️ Utilizing Technical Indicators
Technical indicators can provide additional insights into market behavior:
- Moving Averages (MA): Smooth out price data to identify trends over time.
- Relative Strength Index (RSI): Measures the speed and change of price movements to identify overbought or oversold conditions.
- MACD (Moving Average Convergence Divergence): Shows the relationship between two moving averages to identify potential buy or sell signals.
Combining these indicators with chart patterns can enhance your trading strategy.
🧩 Recognizing Chart Patterns
Certain patterns can signal potential market movements:
- Head and Shoulders: Indicates a potential reversal from an uptrend to a downtrend.
- Double Top/Bottom: Suggests a reversal after two failed attempts to break through a support or resistance level.
- Triangles (Ascending, Descending, Symmetrical): Show consolidation periods that may precede a breakout.
Identifying these patterns can help you anticipate future price movements.
🚀 Ready to Enhance Your Trading Skills?
Join the EPIQ Trading Floor, where you’ll gain access to:
- Comprehensive educational resources, including our Trading Academy.
- Real-time trade alerts and market analysis.
- Live trading sessions and Q&A with experienced traders.
- A supportive community to help you grow as a trader.
🎯 Start your 3-day free trial now → epiqtradingfloor.com
⚠️ Disclaimer:
This content is for informational purposes only and does not constitute financial advice. Always conduct your own research before making trading decisions.


Responses