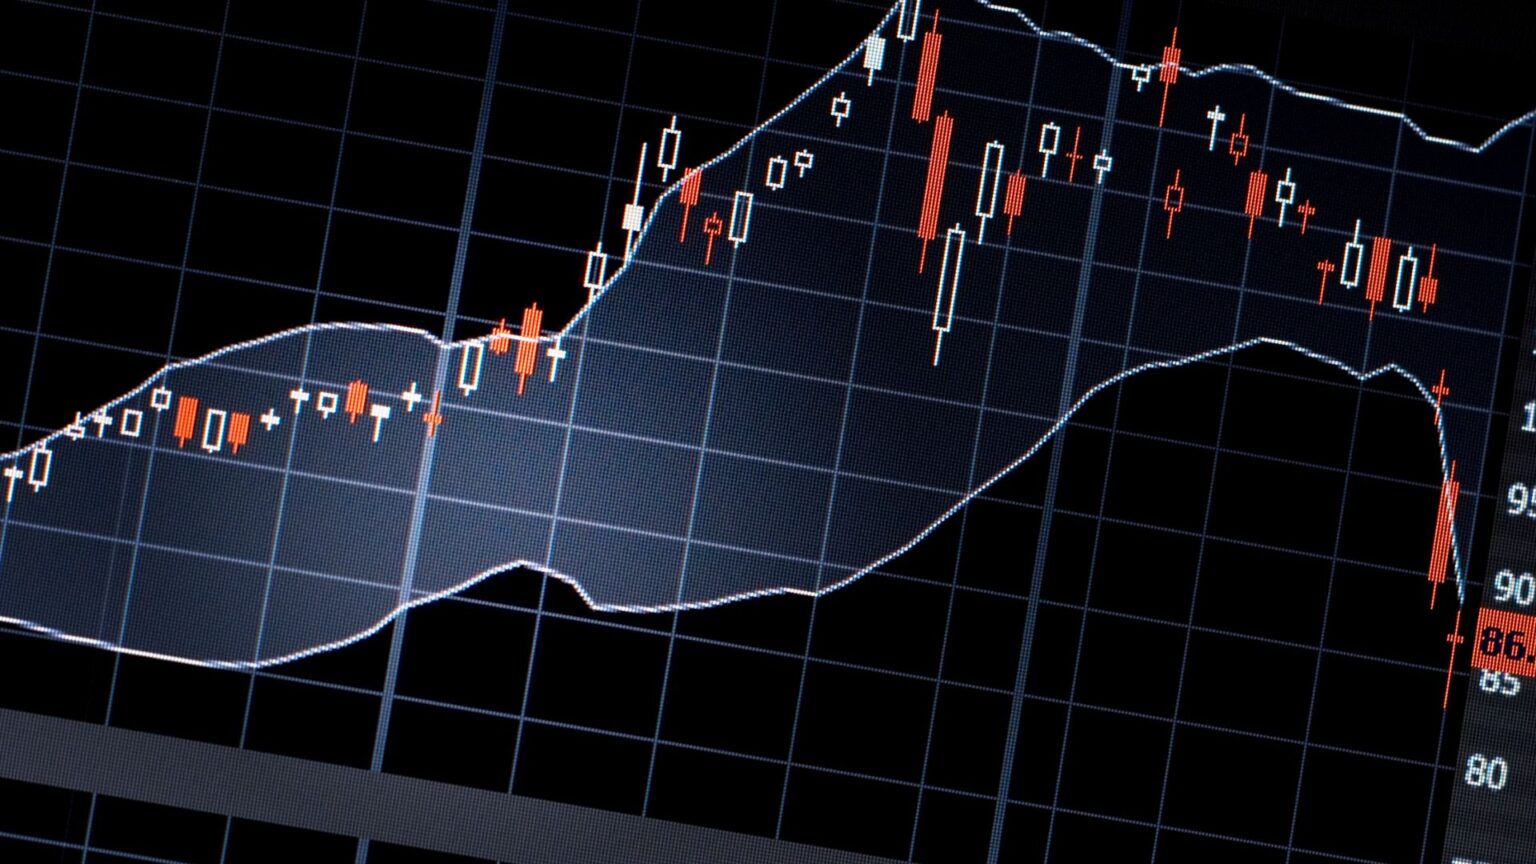
Navigating financial markets can be overwhelming, especially for beginners. Understanding market trends, however, is a crucial skill that can help you spot opportunities and make informed trading decisions. This guide will break down the basics of identifying market trends and teach you how to leverage them for your benefit.
If you’re ready to take your trading to the next level, join the EPIQ Trading Floor for expert insights, real-time trading signals, and a supportive community. Sign up today for a 3-day free trial and start mastering the markets.
What Are Market Trends?
A market trend refers to the general direction in which an asset’s price is moving over time. Trends can be upward (bullish), downward (bearish), or sideways. Understanding the prevailing trend in a market is essential for making informed decisions about when to enter or exit trades.
The Three Main Types of Trends:
- Uptrend: A sustained rise in prices, typically characterized by higher highs and higher lows. In an uptrend, the bulls are in control, pushing prices upward.
- Downtrend: A consistent fall in prices, with lower highs and lower lows. In a downtrend, the bears dominate the market.
- Sideways (Range-Bound): When prices move within a specific range without forming a clear upward or downward direction. This indicates market indecision or a period of consolidation.
Identifying these trends is the foundation of any successful trading strategy, and it helps traders decide whether to buy, hold, or sell an asset.
Tools for Identifying Market Trends
1. Moving Averages
Moving averages are one of the simplest and most effective tools for identifying trends. A moving average smooths out price fluctuations by calculating the average price of an asset over a set period of time.
Types of Moving Averages:
- Simple Moving Average (SMA): The average price over a specific number of days (e.g., 50-day SMA).
- Exponential Moving Average (EMA): Gives more weight to recent prices, making it more responsive to price changes.
How to Use:
- When the current price is above the moving average, it may indicate an uptrend.
- When the price is below the moving average, it may signal a downtrend.
2. Relative Strength Index (RSI)
RSI is a momentum indicator that measures the strength of recent price changes. It ranges from 0 to 100 and helps identify whether an asset is overbought (above 70) or oversold (below 30).
- Overbought: A potential reversal may be on the horizon as the asset could be overpriced.
- Oversold: The asset may be undervalued, offering a buying opportunity.
3. MACD (Moving Average Convergence Divergence)
The MACD is a trend-following indicator that reveals changes in momentum by comparing two moving averages. When the MACD line crosses above the signal line, it’s typically a bullish signal, and when it crosses below, it’s considered bearish.
Spotting Trading Opportunities in Different Trends
Trading in an Uptrend
In an uptrend, traders aim to buy on pullbacks (temporary declines in price) to ride the trend higher. These pullbacks offer an opportunity to enter the market at a lower price while still moving in the direction of the prevailing trend.
Key Tip:
Use support levels and Fibonacci retracement levels to determine where a pullback might end and the trend resumes.
Trading in a Downtrend
During a downtrend, traders generally look for opportunities to sell or short an asset. This can be done by selling when the price bounces off resistance levels (areas where price struggles to break through).
Key Tip:
Bearish traders often wait for confirmation of trend continuation using indicators like the MACD or RSI before entering positions.
Trading in a Sideways Market
Sideways markets are trickier to trade because there’s no clear direction. Traders in these markets typically buy at support and sell at resistance levels, focusing on short-term gains.
Key Tip:
Use oscillators like RSI or Stochastic indicators to help identify when the price is likely to reverse within the range.
The Importance of Risk Management
Understanding market trends is only part of the equation. Risk management is equally important for long-term success. Traders should always use stop-loss orders to minimize potential losses, especially in volatile markets.
Key Risk Management Tools:
- Stop-Loss Orders: Automatically sell an asset when it hits a certain price, limiting your losses.
- Position Sizing: Allocate only a small percentage of your capital to each trade to avoid significant losses on any single position.
Conclusion: The Path to Becoming a Market Trend Expert
Mastering market trends takes time, but with the right tools and strategies, it’s possible to make more informed trading decisions. By learning to identify and capitalize on trends, you’ll be well on your way to spotting profitable opportunities and growing your portfolio.
Ready to Dive Deeper?
Join the EPIQ Trading Floor today to access powerful trend analysis tools, live trading signals, and a community of experienced traders who can help you elevate your trading game. Sign up now for a 3-day free trial and start trading smarter.
Disclaimer: The information provided in this blog is for educational purposes only and does not constitute financial advice. Always conduct your own research and consult with a financial professional before making any trading decisions.


Responses